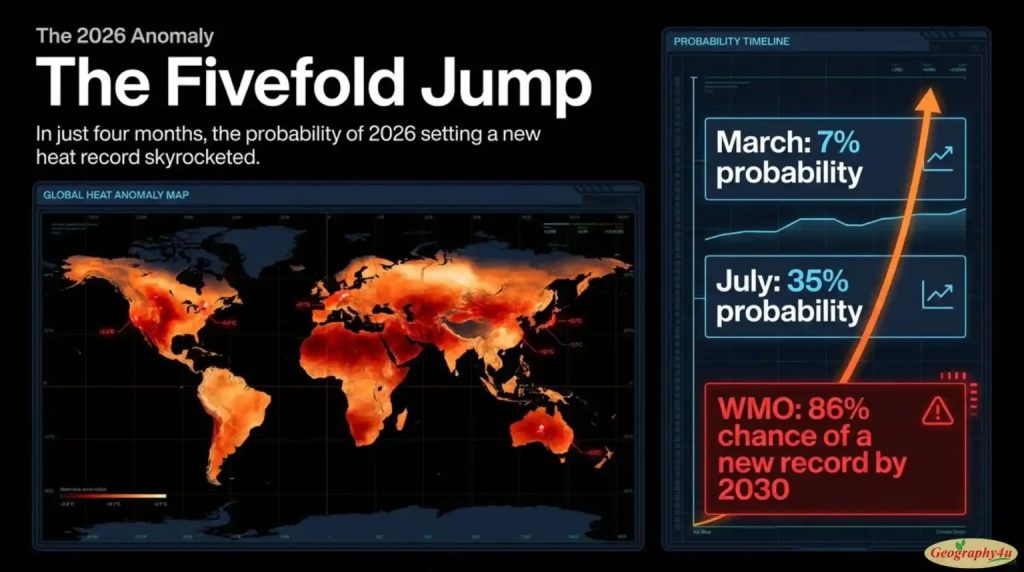
In March 2026, forecasters put the chance that this year would set a new global temperature record at just 7 percent. Four months later, in July, that number had jumped to 35 percent — nearly a fivefold increase in a single quarter, driven almost entirely by a rapidly strengthening El Niño in the Pacific Ocean. On June 21, 2026, global sea surface temperatures broke the record for that date. The World Meteorological Organization now reports an 86 percent chance that at least one year between 2026 and 2030 will surpass 2024 as the hottest year ever recorded — and a 91 percent chance that global temperatures will temporarily exceed 1.5°C above pre-industrial levels during at least one of the next five years.
This is not a forecast about the distant future. This is the climate story of 2026, unfolding in real time.
Climate change has moved from something scientists warned about to something that shows up on the six o’clock news — a heatwave in France killing 2,700 people, a heat dome smothering 140 million Americans, forest fires across Morocco, floods across West Africa, all in the space of a few weeks. This is the guide to what is actually happening, what the data says, and what it means for the years ahead.
- What Is Climate Change? (The Simple Explanation)
- Weather vs. Climate: The Critical Distinction
- The Evidence: How We Know Earth Is Warming
- Global Temperature in 2026: Where We Are Now
- The 1.5°C Threshold: What It Means
- The Greenhouse Effect: How It Actually Works
- What Causes Climate Change?
- 1. Burning Fossil Fuels (Roughly 75% of Emissions)
- 2. Agriculture and Land Use (Roughly 18%)
- 3. Deforestation and Land Use Change (Roughly 6-10%)
- 4. Other Sources
- The Cumulative Problem
- The Arctic: Ground Zero for Climate Change
- Sea Level Rise: The Slow Emergency
- Extreme Weather in 2026: The New Normal
- The France Heatwave (June 2026)
- The US Heat Dome (July 2026)
- Morocco Fire Alerts
- West Africa Floods
- Global Ocean Records
- El Niño and Climate Change: The 2026 Combination
- The Paris Agreement: Progress and Failure
- The Progress
- The Failure
- The Realistic View
- What Can Be Done?
- Individual Actions (Small But Real)
- Policy and Systemic Change (Where the Real Leverage Is)
- Technology and Innovation
- Adaptation
- Frequently Asked Questions
- What is climate change in simple terms?
- How hot will 2026 be?
- What is the 1.5°C target?
- How is the Arctic being affected by climate change?
- Is El Niño making climate change worse?
- What causes climate change?
- What is the greenhouse effect?
- Is sea level really rising?
- What is happening with extreme weather in 2026?
- Can climate change still be limited?
- Final Thoughts: The Decade That Matters
What Is Climate Change? (The Simple Explanation)
Climate change refers to long-term shifts in Earth’s average temperatures and weather patterns. Earth’s climate has always changed — ice ages have come and gone, sea levels have risen and fallen, deserts have replaced rainforests and vice versa. What is unprecedented about the current period is not that the climate is changing, but the speed at which it is changing and the cause: human activity, primarily the burning of fossil fuels since the Industrial Revolution.
Long-term global warming is currently at approximately 1.4°C above pre-industrial levels. In practical terms, that means the Earth today is warmer than it has been at any point in the past 125,000 years. Nine of the ten warmest years on record have all occurred since 2015. The rate of warming since 1980 has been three times faster than at any point in the previous 800,000 years, according to ice core records.
The scientific consensus is not a matter of opinion or political preference. Every major scientific organization on Earth — NASA, NOAA, the UK Met Office, the World Meteorological Organization, the European Copernicus Climate Change Service, and hundreds of others — agrees on three points:
- Earth is warming rapidly.
- The warming is caused primarily by human emissions of greenhouse gases.
- Without significant action to reduce emissions, the warming will continue and its impacts will worsen.
Earth’s climate has always changed. What’s unprecedented today is the speed of change and its cause: human activity.
Weather vs. Climate: The Critical Distinction
The single most common source of confusion in climate discussions is the difference between weather and climate. Understanding this distinction is essential.
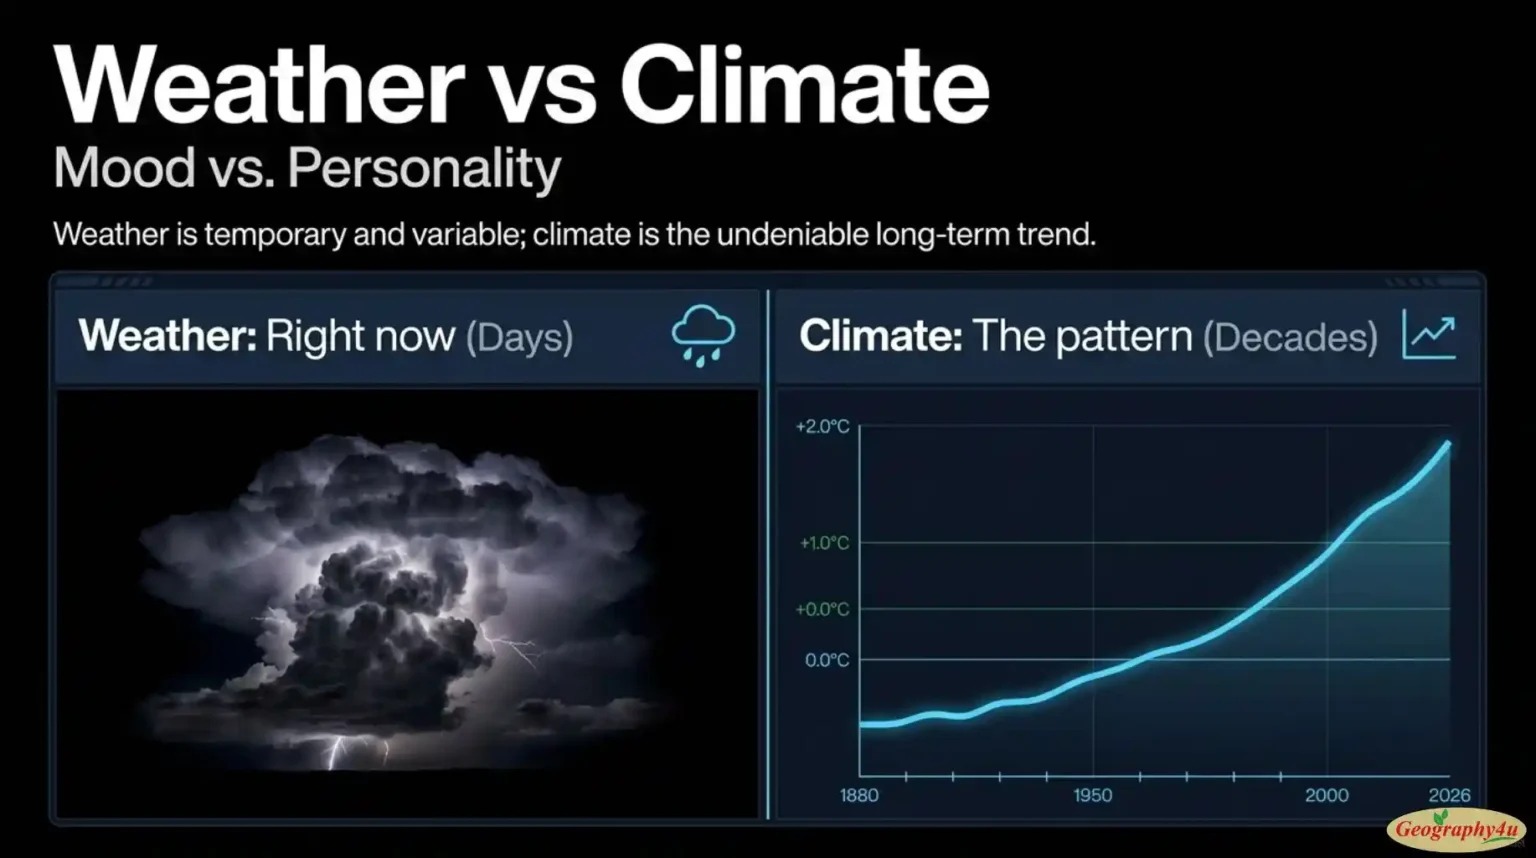
Weather is what is happening in the atmosphere right now, or over the next few days, in a specific place. It is the temperature outside your window this afternoon, the thunderstorm expected tomorrow, the snowfall you got last Tuesday. Weather is inherently variable and unpredictable beyond about 10 days.
Climate is the long-term pattern of weather in a region, typically measured over 30 years or more. Climate is what you expect — average temperatures for July, typical rainfall in monsoon season, how often hurricanes strike a coastline over decades.
Climate change refers to shifts in the long-term climate patterns, not day-to-day weather. A cold winter day does not disprove climate change any more than a hot summer day proves it. What matters is the trend across decades — and that trend is unambiguously toward higher temperatures.
The classic analogy: weather is your mood on any given day. Climate is your personality across your lifetime. A cheerful person can have a bad day; a warming planet can have a cold winter. Neither invalidates the underlying pattern.
The Evidence: How We Know Earth Is Warming
The evidence for climate change comes from dozens of independent measurement systems, all pointing in the same direction. This is not a single line of data that could be wrong. It is a convergent body of evidence that would require every major scientific institution on Earth to be mistaken in the same way — a scenario for which there is no plausible mechanism.
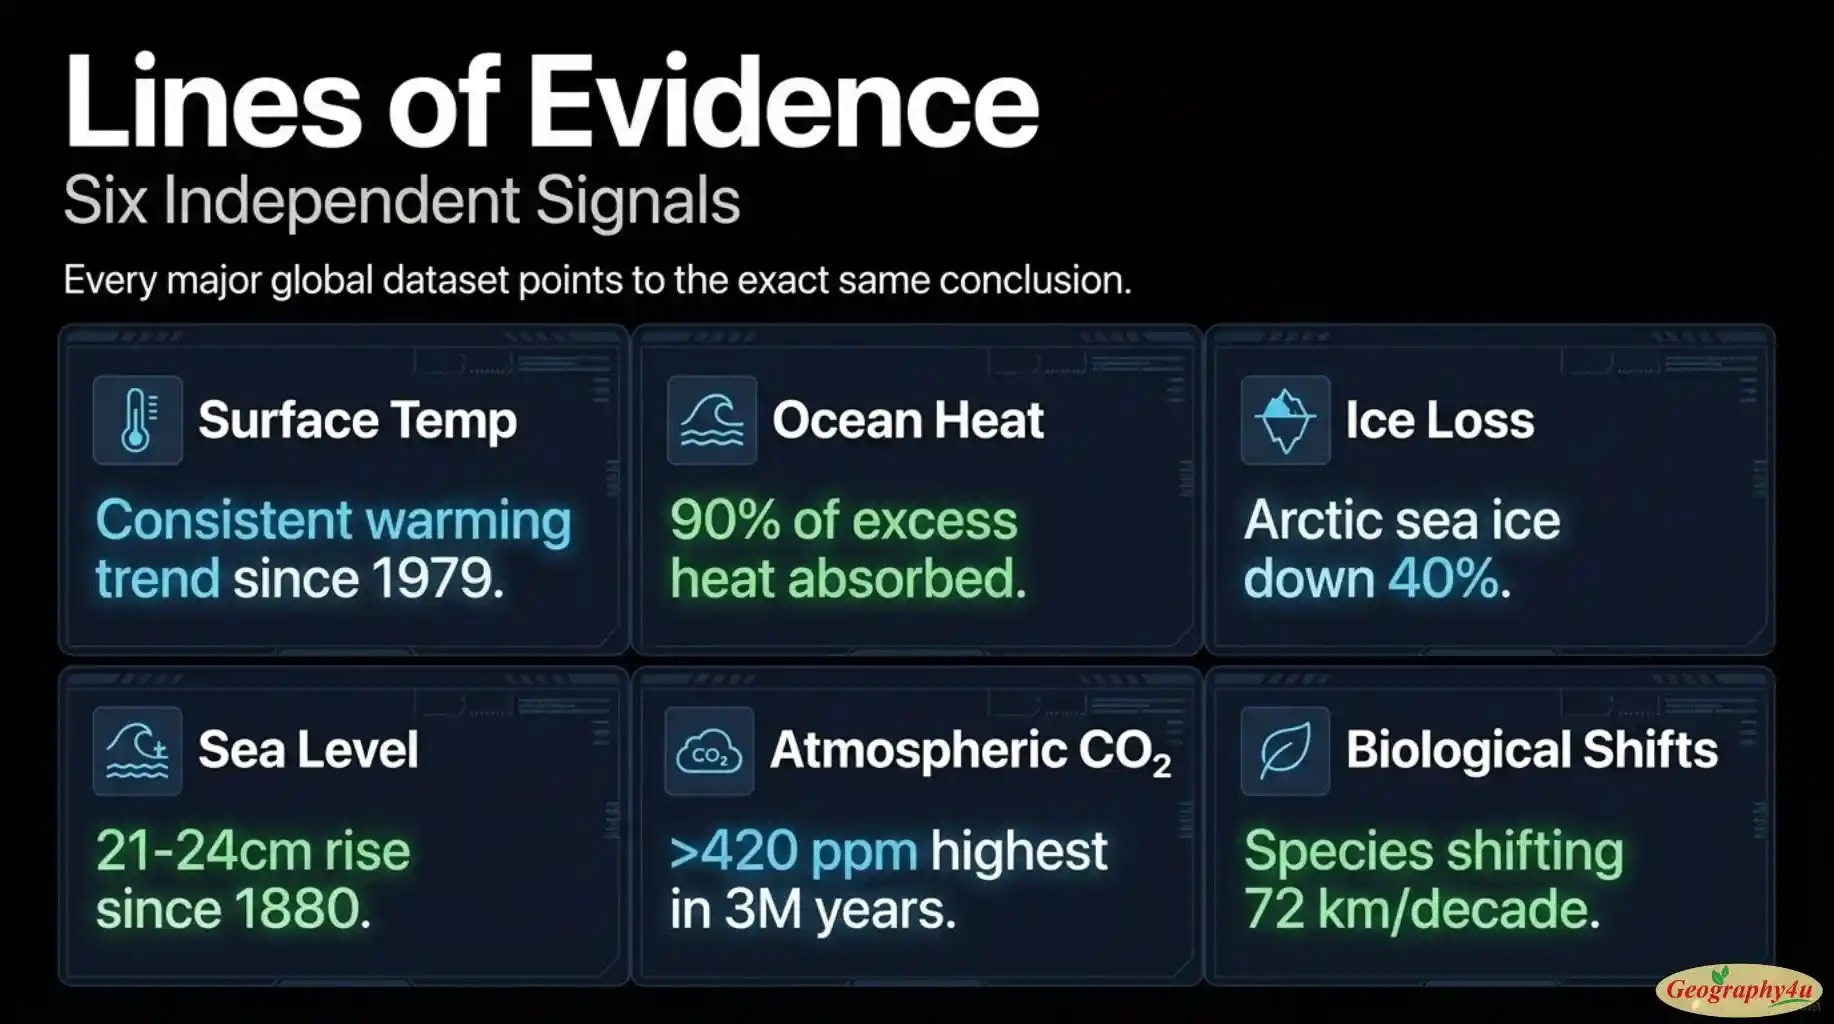
Surface temperature records: Thousands of weather stations around the world, combined with satellite measurements dating back to 1979, show consistent warming. NASA GISS, NOAA, Berkeley Earth, the UK Met Office, and the Japanese Meteorological Agency all produce independent temperature records — and all show the same warming trend.
Ocean heat content: The oceans have absorbed roughly 90 percent of the extra heat trapped by human emissions. Deep-ocean temperature measurements from the Argo float network confirm that ocean heat content is at record highs and rising. The oceans are effectively acting as Earth’s thermal buffer — without them, atmospheric warming would be far more severe.
Ice loss: Arctic sea ice extent has declined by roughly 40 percent in summer since satellite measurements began in 1979. Greenland and Antarctica are collectively losing over 400 billion tons of ice per year. Mountain glaciers worldwide are in retreat.
Sea level rise: Tide gauges dating back over a century and satellite altimetry since 1993 both confirm a global sea level rise of approximately 21-24 centimeters since 1880. The rate has accelerated to about 3.4 millimeters per year — roughly double the 20th-century average.
Atmospheric CO2: Ice cores let scientists reconstruct atmospheric composition over hundreds of thousands of years. CO2 was stable at 250-280 parts per million for most of the past 800,000 years. Today it is over 420 parts per million — a 50 percent increase, and higher than at any point in at least 3 million years.
Biological indicators: Plant flowering times have shifted earlier by an average of 4-6 days per decade. Bird migration patterns have changed. Growing seasons in northern latitudes have lengthened. Marine species are shifting toward the poles at an average of 72 kilometers per decade.
Each of these datasets, taken alone, could theoretically have some measurement problem. Taken together, all pointing the same direction, they represent one of the most robust scientific conclusions of our time.
Global Temperature in 2026: Where We Are Now
2026 opened with a paradox. The exceptional warmth of 2023 and 2024 had faded as the previous La Niña ended and the Pacific entered a cool-neutral phase. In fact, the first six months of 2026 have been about 0.13°C cooler than the same period in 2024. On the surface, this looked like a “cooling” year.
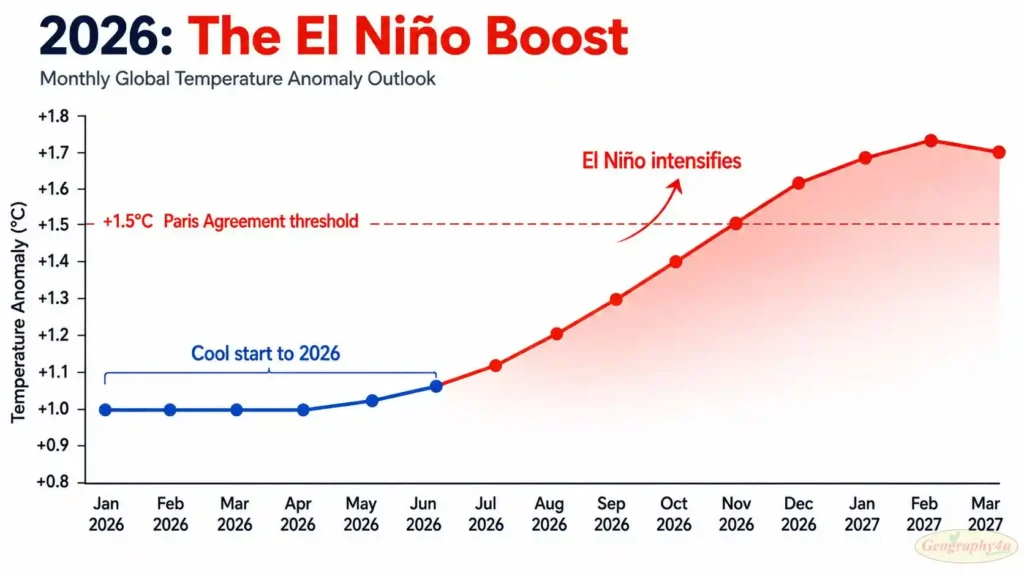
But underneath the surface, something remarkable was happening. Sea surface temperatures in the tropical Pacific were rising at extraordinary speed. What in March had been a 10 percent probability of an El Niño developing became, by July, a rapidly intensifying event that NOAA now projects could be the strongest in a century.
The result: forecasts for 2026 have been climbing rapidly throughout the year.
| Assessment Date | Chance of 2026 Setting New Record |
|---|---|
| March 2026 | 7% (Carbon Brief) |
| May 2026 | 2.5% (Berkeley Earth) |
| June 2026 | 12% (Berkeley Earth) |
| July 2026 | 35% (Carbon Brief) |
The reason for the divergence between agencies is that Berkeley Earth focuses on the full calendar year 2026, while Carbon Brief’s July update incorporates the latest El Niño forecasts that suggest peak warming will arrive in late 2026 and continue into 2027 — which affects the annual average.
Regardless of whether 2026 itself breaks the record, the WMO’s five-year outlook makes clear where things are headed: 86 percent probability that at least one year between 2026 and 2030 will surpass 2024 as the hottest ever recorded. Annual global temperatures for 2026-2030 are projected to range between 1.3°C and 1.9°C above the 1850-1900 baseline.
Related read: Why El Niño 2026 May Push Global Temperatures to Record Highs →
The 1.5°C Threshold: What It Means
The number “1.5°C” appears constantly in climate discussions. It comes from the 2015 Paris Agreement, in which nearly every country in the world agreed to hold “the increase in the global average temperature to well below 2°C above pre-industrial levels and to pursue efforts to limit the temperature increase to 1.5°C above pre-industrial levels.”
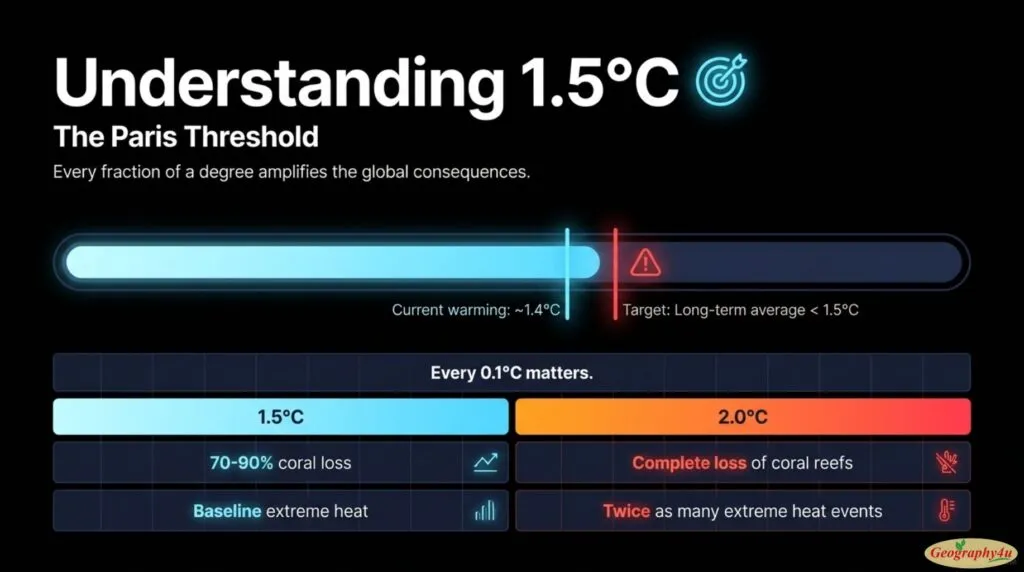
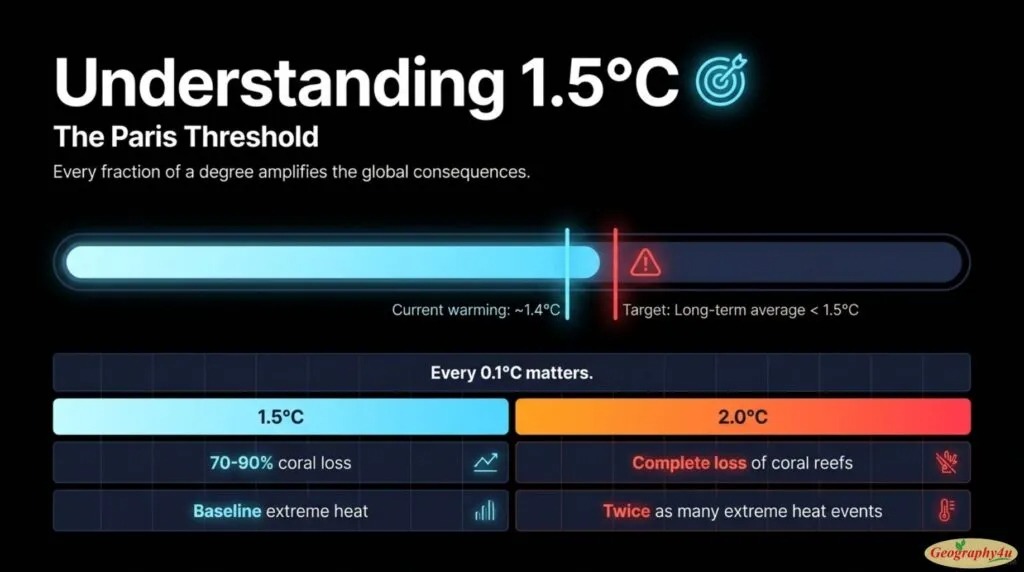
Pre-industrial is defined as the period 1850-1900, before large-scale fossil fuel burning began to alter the atmosphere. Long-term global warming today is approximately 1.4°C above that baseline — meaning we are extraordinarily close to the 1.5°C threshold.
A critical technical point that is widely misunderstood: a single year above 1.5°C does not by itself breach the Paris goal. The 1.5°C target refers to the long-term average temperature, typically measured over a 20-year period. The Intergovernmental Panel on Climate Change (IPCC) uses the midpoint of a 20-year window to define the current level of warming.
This distinction matters because 2024 briefly crossed 1.5°C — the first calendar year to do so — driven partly by El Niño. That did not mean the Paris goal had been breached. But it did mean the world had reached the boundary in temporary form, and the long-term threshold is likely to be crossed permanently by the end of this decade at current emission rates.
Every 0.1°C matters. The difference between 1.5°C and 2°C of warming, which sounds small, translates to:
- Twice as many extreme heat events
- Twice the number of species losing over half their range
- Complete loss of coral reefs at 2°C (versus 70-90 percent loss at 1.5°C)
- Substantially higher sea level rise by 2100
- Millions more people exposed to extreme flooding
Climate change is not a binary threshold. It is a continuum, and every fraction of a degree carries real consequences.
The Greenhouse Effect: How It Actually Works
To understand why human emissions cause warming, you need to understand the greenhouse effect — a physical process that has been well-understood since the 1850s.
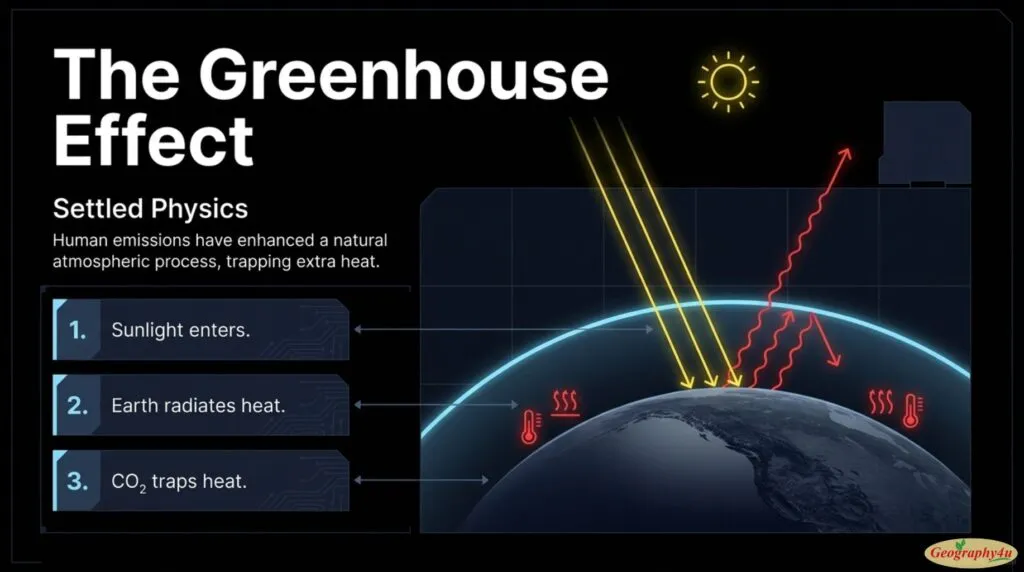
Earth receives energy from the Sun in the form of visible light. Most of this light passes through the atmosphere and warms Earth’s surface. The surface, now warmed, radiates energy back toward space — but in a different form: infrared radiation (heat).
Here is where greenhouse gases come in. Certain molecules in the atmosphere — most importantly carbon dioxide (CO2), methane (CH4), water vapor (H2O), and nitrous oxide (N2O) — have the physical property of absorbing infrared radiation. When they absorb this outgoing heat, they re-emit it in all directions, including back toward Earth’s surface. This traps some of the heat that would otherwise escape into space.
Without any greenhouse effect, Earth’s average surface temperature would be approximately -18°C — cold enough to freeze the oceans. With the natural greenhouse effect, Earth’s average surface temperature is approximately +14°C, warm enough for the water, life, and civilization we know. The greenhouse effect is essential to life on Earth.
The problem is not the greenhouse effect itself. The problem is that human emissions have significantly increased the concentration of greenhouse gases in the atmosphere. Atmospheric CO2 has risen from 280 parts per million before the Industrial Revolution to over 420 parts per million today — a level not seen in at least 3 million years. This enhanced greenhouse effect is trapping additional heat, driving the warming we observe.
The physics is not disputed. The heat-trapping property of CO2 was first measured in laboratory experiments by Eunice Foote in 1856 and John Tyndall in 1859. Every physics textbook confirms it. The debate is not about whether CO2 traps heat — that is settled science. The debate is about how much, how fast, and what to do about it.
What Causes Climate Change?
Human-caused climate change has multiple sources, but they can be organized into a few major categories.
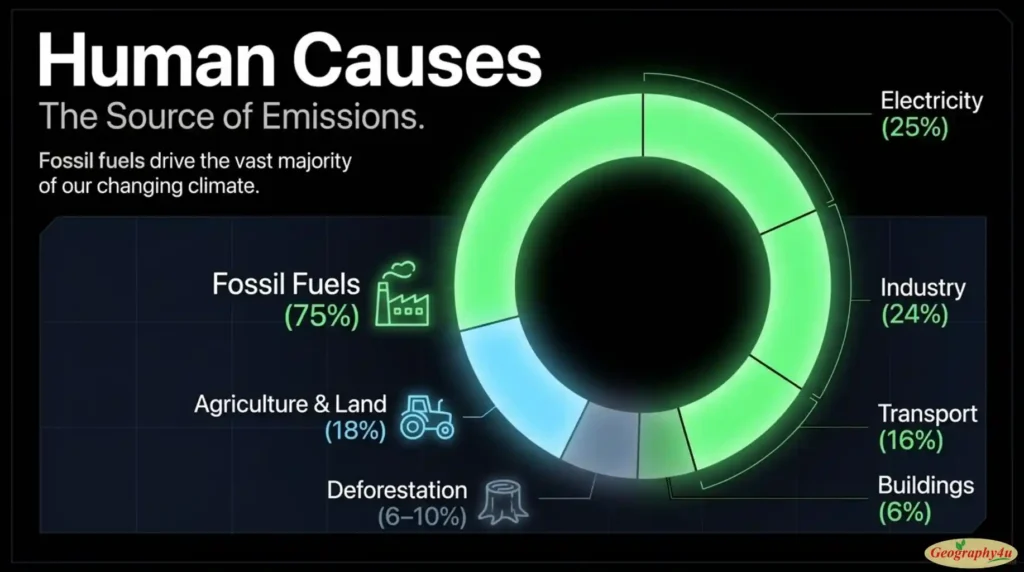
1. Burning Fossil Fuels (Roughly 75% of Emissions)
Coal, oil, and natural gas — collectively called fossil fuels — release carbon dioxide when burned. This is the single largest source of climate change. It includes:
- Electricity generation — coal and gas power plants (about 25% of global emissions)
- Transportation — cars, trucks, ships, and airplanes running on petroleum (about 16%)
- Buildings — heating and cooking with natural gas or oil (about 6%)
- Industry — steel, cement, chemicals, and manufacturing (about 24%)
2. Agriculture and Land Use (Roughly 18%)
Modern agriculture produces significant greenhouse gases through multiple pathways. Cattle and other livestock produce methane during digestion — a gas that is roughly 80 times more powerful than CO2 at trapping heat over 20 years. Rice paddies produce methane as organic matter decomposes underwater. Synthetic nitrogen fertilizers produce nitrous oxide, another potent greenhouse gas. And deforestation to make room for crops and pasture releases the carbon stored in trees.
3. Deforestation and Land Use Change (Roughly 6-10%)
Forests act as carbon sinks — they absorb CO2 from the atmosphere and store it in wood and soil. When forests are cut down or burned, that stored carbon is released back into the atmosphere. Tropical deforestation, particularly in the Amazon, Southeast Asia, and Central Africa, is a major driver of continuing emissions.
4. Other Sources
Waste (landfills producing methane), certain industrial processes (cement production, refrigerant leakage), and chemical manufacturing round out the emissions picture. Individually small, collectively meaningful.
The Cumulative Problem
The climate system responds not just to today’s emissions but to the cumulative total of all emissions since the Industrial Revolution. CO2 released today will remain in the atmosphere affecting temperatures for centuries. This is why past emissions matter — and why historical responsibility is such a contentious diplomatic issue.
The Arctic: Ground Zero for Climate Change
If you want to see climate change happening in real time, look north. The Arctic is warming approximately four times faster than the global average — a phenomenon known as Arctic amplification.
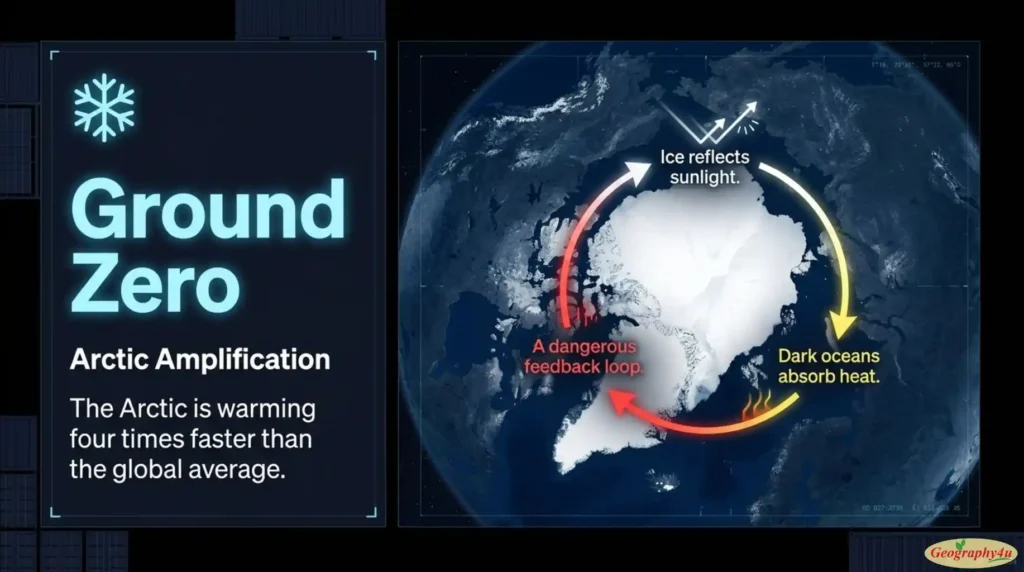
The mechanism is a positive feedback loop called the ice-albedo effect. White ice and snow reflect roughly 80 percent of incoming sunlight back into space. Dark ocean water absorbs roughly 90 percent of that same sunlight. When Arctic ice melts, it exposes darker ocean surface, which absorbs more heat, which melts more ice, which exposes more dark ocean — an accelerating cycle.
The 2025-2026 Arctic ice data is stark:
- December 2025 Arctic sea ice extent was the lowest ever recorded for that month — 1,620,000 square kilometers below the 1981-2010 average. December is normally a month of strong ice formation, which makes this record particularly consequential.
- The oldest and thickest multi-year sea ice has declined by more than 95 percent since the 1980s. The Arctic used to be covered largely by ice several years old, thick and resilient. Most of that ice is gone.
- The Arctic region experienced its warmest year in 125 years of modern record keeping from October 2024 to September 2025.
- The last 10 years are the 10 warmest years on record in the Arctic — an unbroken sequence of record warmth.
Arctic warming matters far beyond the Arctic. Reduced temperature contrast between the Arctic and mid-latitudes affects the jet stream, potentially causing weather patterns to become more stuck in place — contributing to longer heat waves, more persistent droughts, and extended cold snaps in mid-latitudes. Melting Greenland ice contributes directly to global sea level rise. Thawing permafrost releases stored methane, adding to greenhouse gas emissions in a self-reinforcing cycle.
Related read: Aurora Borealis and the Changing Arctic Atmosphere →
Sea Level Rise: The Slow Emergency
Sea level rise is climate change in slow motion — a threat that unfolds over decades and centuries, but with impacts that will reshape coastlines permanently.
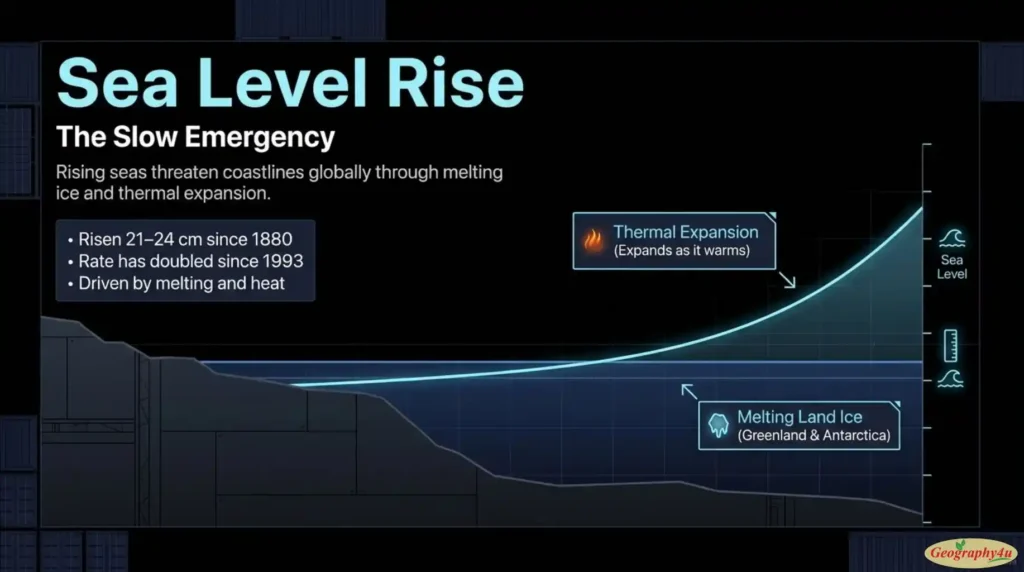
Global sea level has risen approximately 21-24 centimeters since 1880. The rate of rise has accelerated significantly. During the 20th century, sea level rose at about 1.4 millimeters per year. Since 1993, when satellite altimetry began providing precise global measurements, the rate has been approximately 3.4 millimeters per year — more than double the historical rate.
Sea level rise comes from two main sources:
Thermal expansion: Water expands as it warms. Even without any ice melting, warmer oceans occupy more volume than cooler ones. Roughly one-third of observed sea level rise comes from this thermal expansion.
Melting land ice: Ice sitting on land — the Greenland Ice Sheet, the Antarctic Ice Sheet, and mountain glaciers around the world — adds new water to the ocean when it melts. Roughly two-thirds of observed sea level rise comes from melting land ice.
A new study published in 2025 warned that some coastal areas could see sea level rise of 8-12 inches per decade within the lifetime of today’s youngest generations — outpacing the ability of many coastal communities to adapt. Even limiting warming to 1.5°C, according to this research, is not enough to prevent significant polar ice sheet loss.
The impacts extend far beyond obvious flooding. Rising seas cause saltwater intrusion into freshwater aquifers, damaging drinking water supplies. They accelerate coastal erosion. They amplify storm surges from hurricanes and cyclones. And they threaten trillions of dollars in coastal infrastructure — ports, airports, roads, sewage systems, and residential property.
Related read: How Sea Level Rise Amplifies Hurricane Storm Surge →
Extreme Weather in 2026: The New Normal
The single clearest way ordinary people experience climate change is through extreme weather. And 2026 has already delivered a punishing series of events consistent with everything climate scientists have been projecting for decades.
The France Heatwave (June 2026)
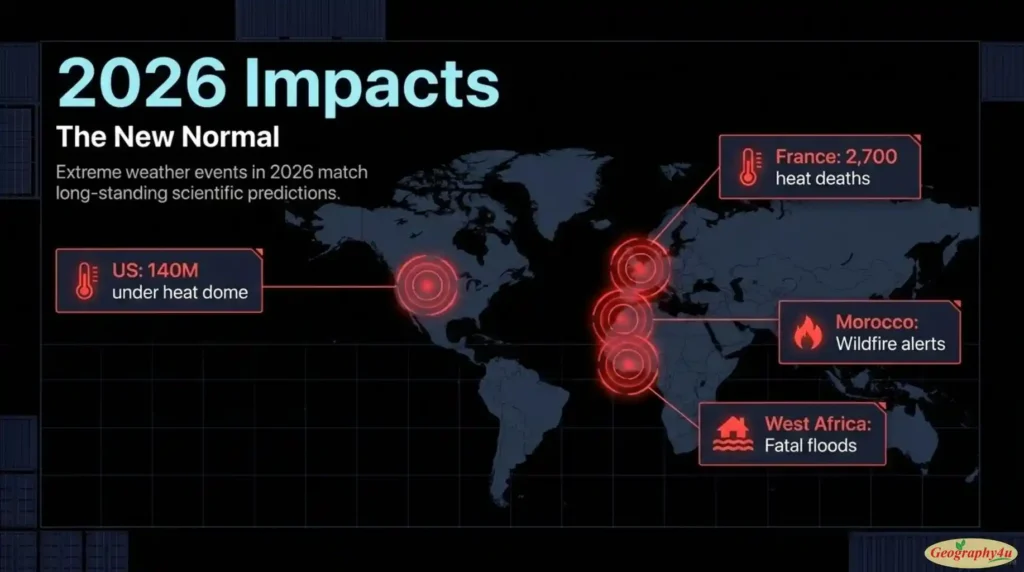
Southern Europe experienced a heatwave in June 2026 so severe that France alone recorded more than 2,700 heat-related deaths. Temperatures exceeded 40°C across large portions of the country. Similar heatwaves swept across Spain, Italy, and Portugal. These events reflect a clear pattern: European heatwaves have become both more frequent and more intense, with climate change identified as the primary driver by multiple attribution studies.
The US Heat Dome (July 2026)
A massive heat dome settled over the eastern United States in early July 2026, placing more than 140 million Americans under heat alerts. Twenty-plus states experienced temperatures exceeding 38°C. At least 25 heat-related deaths were reported. The heat dome was one of the most extensive in recent US history.
Morocco Fire Alerts
Morocco issued red alerts for forest fires across 20 provinces in early July 2026 as temperatures reached 46°C. The fire risk warning came alongside a heat wave alert issued by the country’s General Directorate of Meteorology.
West Africa Floods
At least 71 people died across Ivory Coast and Ghana following intense torrential downpours in July 2026. The severe weather caused widespread flooding and devastating landslides.
Global Ocean Records
Global sea surface temperatures broke the June record in 2026, reaching 20.86°C on June 21 — narrowly above the 2024 record. Marine heatwaves were reported across multiple ocean basins, with implications for coral reefs, fisheries, and storm intensity.
The individual events are not each “caused by” climate change in a simple way. But the overall pattern — more frequent extreme heat, more intense rainfall events when they occur, longer droughts, and stronger extreme storms — is exactly what climate models have long projected. Climate change loads the dice. Some rolls come up sixes anyway. Now more sixes come up.
El Niño and Climate Change: The 2026 Combination
The 2026 climate story cannot be told without El Niño. And the interaction between El Niño and long-term climate change deserves careful explanation because it is widely misunderstood.
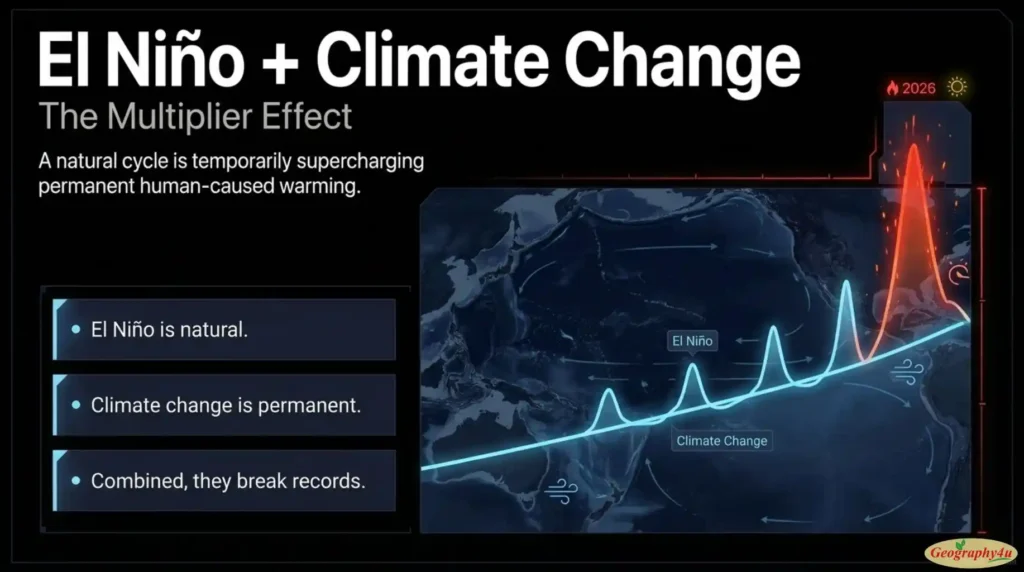
El Niño does not cause climate change. Climate change is driven by greenhouse gas emissions. El Niño is a natural climate pattern that has been cycling in the Pacific Ocean for thousands of years, long before human industrial activity. Even without any greenhouse gas emissions, Earth would still experience El Niño events roughly every 2-7 years.
What El Niño does is temporarily boost global temperatures on top of the underlying warming trend. During El Niño, warm water accumulated in the western Pacific slosthes eastward, releasing enormous amounts of heat from the ocean into the atmosphere. This causes a temporary spike in global average temperature — typically 0.1-0.3°C for a strong event.
The 2026 El Niño is exceptional in two ways:
1. Its speed of development. As recently as February 2026, WMO put the probability of El Niño developing at 10 percent. By July, NOAA’s Geophysical Fluid Dynamics Laboratory ran 30 climate model simulations, and every single one produced a peak intensity “at least competitive with the strongest events over the past century.”
2. Its combination with a warmer baseline. A “moderate” El Niño in 2026 produces higher absolute temperatures than a “strong” El Niño would have in 1980, because the baseline is warmer to begin with. The El Niño is a temporary boost; the climate change is a permanent shift; and they combine.
The consequence: 2026 or 2027 is likely to set a new global temperature record, and the impacts — from heatwaves to droughts to storm-track shifts — will be more severe than an equivalent-strength El Niño would have caused decades ago.
Deep dive: The Complete Guide to the 2026 El Niño Event →
The Paris Agreement: Progress and Failure
The Paris Agreement, adopted in December 2015, was the world’s most significant collective response to climate change. Nearly every country signed on. It set specific temperature goals. And it created a framework for regular updates and improvements.
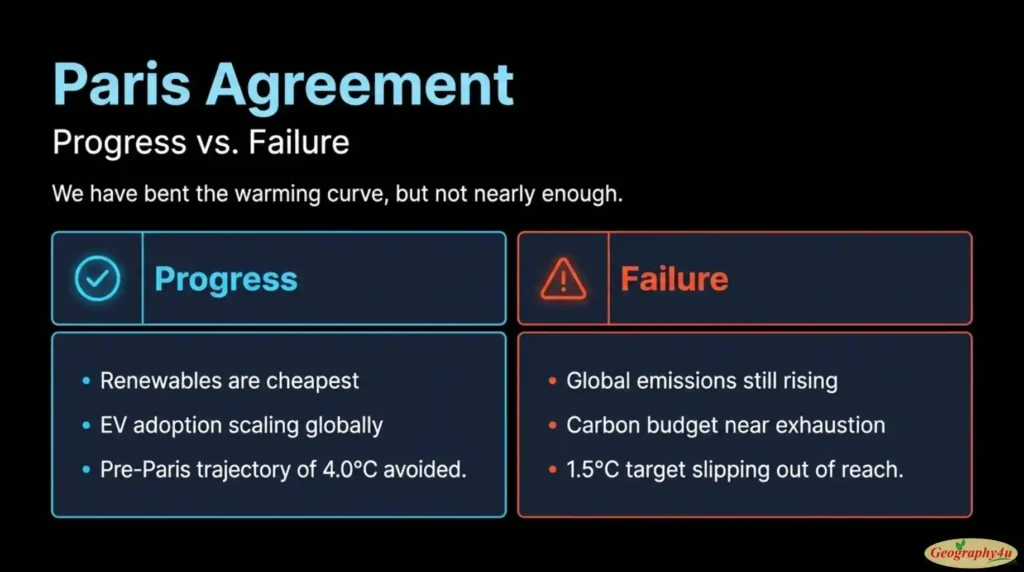
Ten years later, the Paris Agreement is best understood as a partial success — meaningful progress by any historical standard, but nowhere near enough to meet its own targets.
The Progress
Before Paris, business-as-usual trajectories pointed toward 3.7-4.8°C of warming by 2100 — a genuinely catastrophic scenario. Current national commitments under the Paris Agreement, combined with policies already implemented, have reduced projected end-of-century warming to approximately 2.4-2.6°C. That is still far above the 1.5°C target, but it represents a substantial course correction. Solar and wind power have become the cheapest forms of new electricity generation in most of the world. Electric vehicles are scaling rapidly. Coal is in structural decline in most developed countries.
The Failure
To limit long-term warming to 1.5°C, the IPCC calculates that global CO2 emissions would need to fall approximately 43 percent by 2030 relative to 2019, and reach net-zero by 2050. Current commitments are, in the UN’s own words, “nowhere near” enough. Global emissions are still rising, not falling. The remaining “carbon budget” for a 50 percent chance of limiting warming to 1.5°C — approximately 250-275 billion tonnes of CO2 — will be exhausted by roughly 2030 at current emission rates.
The Realistic View
The 1.5°C target is now widely considered out of reach as a strict long-term ceiling. Most credible analysts view 1.5°C as more likely to be a target that is briefly overshot, then reduced back below through aggressive emissions cuts and carbon dioxide removal later in the century. This “overshoot” scenario carries significant risks because some climate impacts are irreversible on human timescales — glaciers do not regrow quickly, coral reefs do not recover in a decade, and once permafrost melts and releases stored methane, it cannot be put back.
The question is no longer whether we will exceed 1.5°C. It is by how much, for how long, and whether we can eventually bring temperatures back down.
What Can Be Done?
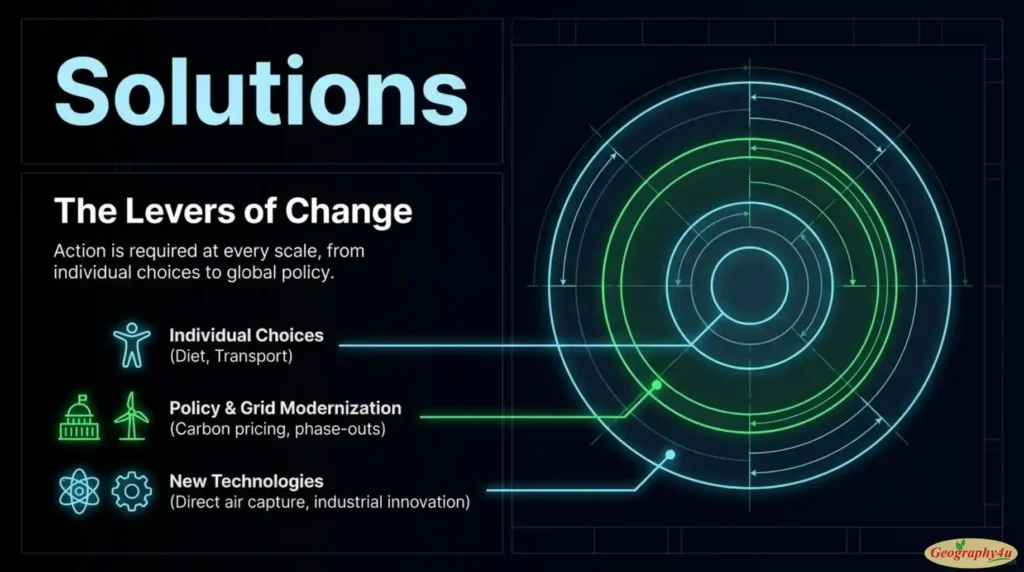
The question “what can be done about climate change” gets asked constantly, often with an implied “nothing” behind it. That answer is wrong. There is enormous scope for action at every level — from individual choices to national policy to international coordination.
Individual Actions (Small But Real)
The impact of any single individual is small, but the cumulative effect of millions of choices is significant. The highest-impact personal decisions:
- Reduce car travel and switch to public transport, walking, cycling, or eventually electric vehicles
- Shift diet toward plant-based foods — beef and lamb are the highest-emission foods per calorie
- Reduce air travel, especially long-haul flights
- Improve home energy efficiency — insulation, LED lighting, efficient heating and cooling
- Choose renewable electricity where available
Individual action is necessary but not sufficient. It builds cultural and political momentum, but the largest emissions come from systems and industries that no individual can change alone.
Policy and Systemic Change (Where the Real Leverage Is)
The most consequential changes happen at national and international level:
- Pricing carbon — through carbon taxes or cap-and-trade systems that make emissions financially costly
- Renewable energy investment — subsidizing the transition away from fossil fuels
- Grid modernization — building the infrastructure to handle variable renewable generation
- Industrial policy — supporting the development of green steel, green cement, sustainable aviation fuels
- Regulation — fuel efficiency standards, building codes, phase-outs of high-emission technologies
- International cooperation — technology transfer to developing countries, climate finance
Technology and Innovation
Some emissions cannot be easily eliminated with existing technology. Cement, steel, aviation, shipping, and heavy industry all require new approaches. Massive research investment in carbon capture, next-generation nuclear, green hydrogen, and direct air capture is underway. Whether any of these scale in time to matter is one of the open questions of the coming decade.
Adaptation
Even with aggressive emission cuts, significant additional warming is already locked in. That means adaptation — building coastal defenses, drought-resistant crops, heat-resilient cities, and disaster preparedness — is now essential alongside mitigation, not an alternative to it.
The most important thing to understand about climate action: every 0.1°C of warming prevented has real, measurable benefits. Even if 1.5°C is out of reach, keeping warming to 1.7°C is vastly better than 2°C. Keeping it to 2°C is vastly better than 3°C. There is no threshold below which action does not matter, and no threshold above which action becomes pointless. The math rewards effort at every level.
Frequently Asked Questions
What is climate change in simple terms?
Climate change refers to long-term shifts in Earth’s average temperatures and weather patterns. While climate has always changed naturally, the current warming trend since the mid-1800s is unprecedented in speed and caused primarily by human burning of fossil fuels. Global average temperatures are now approximately 1.4°C above pre-industrial levels.
How hot will 2026 be?
As of July 2026, Carbon Brief estimates a 35% chance that 2026 will set a new global temperature record — up from 7% in March. The rapid escalation is driven by a strengthening El Niño. The WMO reports an 86% chance that at least one year between 2026 and 2030 will surpass 2024 as the hottest year on record.
What is the 1.5°C target?
The Paris Agreement goal to limit long-term global warming to 1.5°C above pre-industrial (1850-1900) levels. Long-term warming is currently at approximately 1.4°C. The WMO reports a 91% chance that global temperatures will temporarily exceed 1.5°C at least once during 2026-2030, though a single year above 1.5°C does not itself constitute a breach of the goal.
How is the Arctic being affected by climate change?
The Arctic is warming approximately four times faster than the global average — a phenomenon called Arctic amplification. December 2025 Arctic sea ice extent was the lowest ever recorded for that month. The oldest, thickest multi-year sea ice has declined by more than 95% since the 1980s.
Is El Niño making climate change worse?
El Niño does not cause climate change, but it temporarily boosts global temperatures on top of the underlying warming trend. The 2026 El Niño is projected by NOAA models to be one of the strongest in a century, likely pushing 2026 or 2027 to new temperature records.
What causes climate change?
Primarily the burning of fossil fuels (coal, oil, natural gas), which releases CO2 and other greenhouse gases. Other contributors include deforestation, agriculture (methane from livestock, nitrous oxide from fertilizers), and industrial processes. Atmospheric CO2 has risen from 280 ppm pre-industrial to over 420 ppm today.
What is the greenhouse effect?
The natural process by which greenhouse gases in Earth’s atmosphere trap heat that would otherwise escape into space. Without any greenhouse effect, Earth’s surface would average -18°C. Human emissions have amplified this effect, causing warming.
Is sea level really rising?
Yes. Global sea level has risen 21-24 cm since 1880, with the rate accelerating. Since 1993, sea level has risen at about 3.4 mm/year — double the 20th-century average. Main causes: thermal expansion of seawater and melting land ice from Greenland and Antarctica.
What is happening with extreme weather in 2026?
2026 has produced multiple extreme events: France’s June heatwave killed 2,700+, a US heat dome placed 140 million under alerts, Morocco issued red fire alerts across 20 provinces, and West Africa floods killed 71+ in Ivory Coast and Ghana. These match the pattern climate models have long predicted.
Can climate change still be limited?
The physics allows it, but the political window is closing. Limiting warming to 1.5°C requires cutting global CO2 emissions ~43% by 2030 and reaching net-zero by 2050. Current national commitments are inadequate — the UN calls them “nowhere near” enough. But meaningful progress has been made: projected 2100 warming has fallen from 3.7-4.8°C (pre-Paris) to 2.4-2.6°C now.
Final Thoughts: The Decade That Matters
Climate change is often framed as a future problem — something that will affect our grandchildren, that scientists warn about, that governments will eventually address. That framing is wrong. Climate change is a present-day phenomenon, unfolding in the temperature record of 2026, in the deaths of 2,700 French citizens during a June heatwave, in the record-low December Arctic ice, in the Pacific Ocean warming so fast that forecasts had to be revised five times in five months.
The next decade — the years between 2026 and 2036 — will determine whether the century that follows is difficult or catastrophic. That is not hyperbole. It is what the accumulated emissions math implies. Every ton of CO2 not emitted, every fraction of a degree not warmed, every ice sheet not lost, every meter of sea level rise avoided — all of it matters.
The comforting thing about looking at climate change through data instead of headlines is that the picture, while serious, is not hopeless. Solar and wind are the cheapest new electricity in most of the world. Electric vehicles are scaling. Coal is in structural decline. Emissions per unit of GDP are falling almost everywhere. The projected end-of-century warming has been reduced by more than a degree since the Paris Agreement.
The trajectory is not what it needs to be. But it is bending. Whether it bends fast enough is the question of our time.