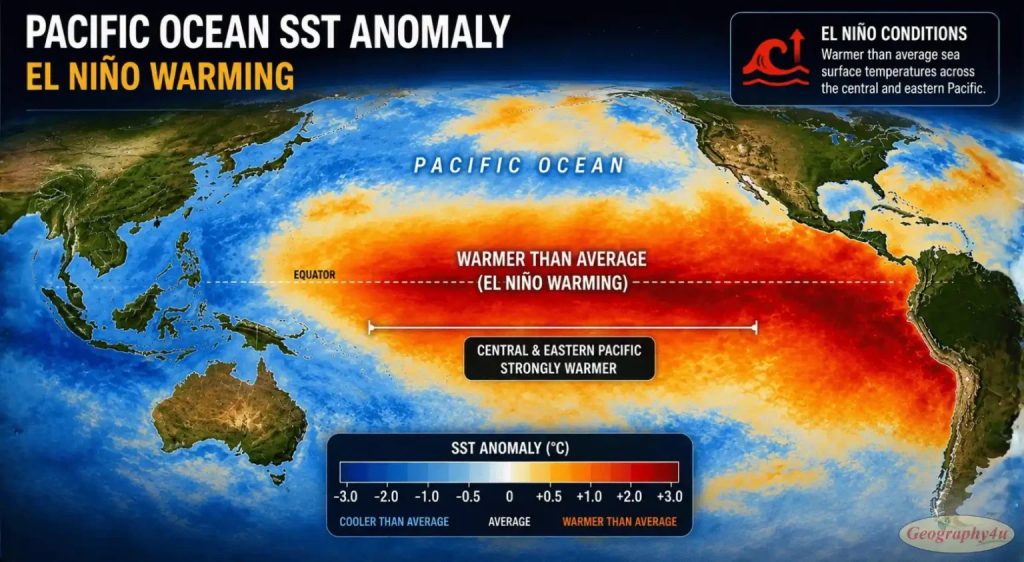
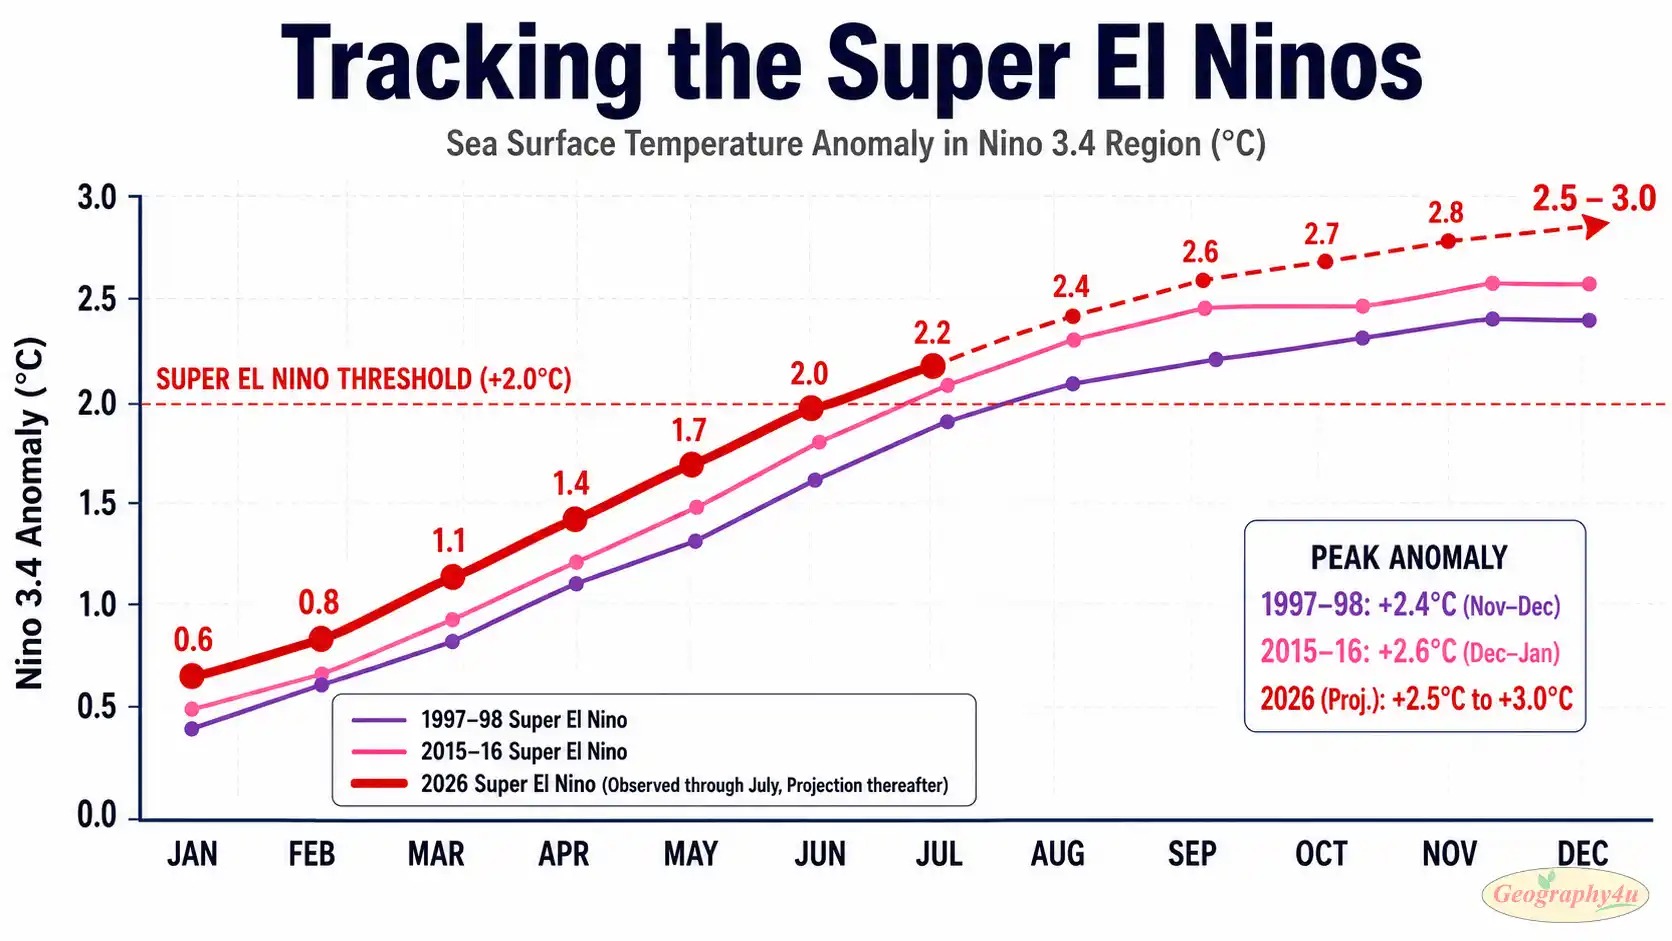
In February 2026, the World Meteorological Organization put the chances of an El Niño developing at 10 percent. Five months later, in July, NOAA’s Geophysical Fluid Dynamics Laboratory ran 30 separate computer simulations of the coming months — and every single one produced a peak El Niño “at least competitive with the strongest events over the past century.” Sea surface temperatures in the eastern Pacific have already reached 2.7°C above normal. The WMO now projects anomalies will exceed 2°C across key monitoring zones before the winter peak — a level associated with the most intense El Niño impacts in the historical record.
From a 10% long-shot in February to a potential once-in-a-generation event by July. That is how fast the ocean can change — and how profoundly that change can reshape weather on the other side of the planet.
If you have been following the news this year — India’s weakened monsoon, a historically quiet Atlantic hurricane season, heatwaves breaking records across three continents — all of these stories trace back to the same three words: El Niño is here.
This is the complete guide. What El Niño is, how the ENSO cycle works, why one patch of warm water in the Pacific can weaken monsoons in India and suppress hurricanes in Florida simultaneously, and what the 2026 event means for the rest of this year and beyond.
- What Is El Niño? (The Simple Explanation)
- What Is La Niña? (The Opposite Phase)
- The ENSO Cycle: How El Niño and La Niña Alternate
- The Walker Circulation: The Engine Behind ENSO
- The Southern Oscillation: The Atmospheric Half
- How El Niño Affects Weather Worldwide
- United States
- South America
- Australia
- Southeast Asia and Indonesia
- East Africa
- Global Temperature
- El Niño and the Indian Monsoon
- El Niño and Atlantic Hurricanes
- The 2026 El Niño: Potentially the Strongest in a Century
- Historical El Niño Events: 1972, 1982, 1997, 2015, and Now 2026
- 1972-73: The First “Modern” El Niño
- 1982-83: The Unexpected Giant
- 1997-98: The “Super El Niño”
- 2015-16: The Longest and Strongest on Record
- 2026: The Event Still Unfolding
- How Scientists Predict El Niño
- El Niño and Climate Change: Are They Getting Stronger?
- Frequently Asked Questions
- What is El Niño in simple terms?
- What is the difference between El Niño and La Niña?
- How strong will El Niño 2026 be?
- How does El Niño affect the United States?
- How does El Niño affect India?
- Does El Niño cause global warming?
- How often does El Niño happen?
- What is the Walker Circulation?
- What is the Southern Oscillation?
- Can we predict El Niño?
- Final Thoughts: The Pattern That Runs the World
What Is El Niño? (The Simple Explanation)
El Niño is a climate pattern that occurs when surface water in the central and eastern Pacific Ocean becomes abnormally warm. The name — Spanish for “the boy child” — was given by South American fishermen who noticed that warm ocean currents sometimes appeared around Christmas, disrupting their anchovy catches. The connection between these warm waters and global weather shifts was not understood until the 1960s.
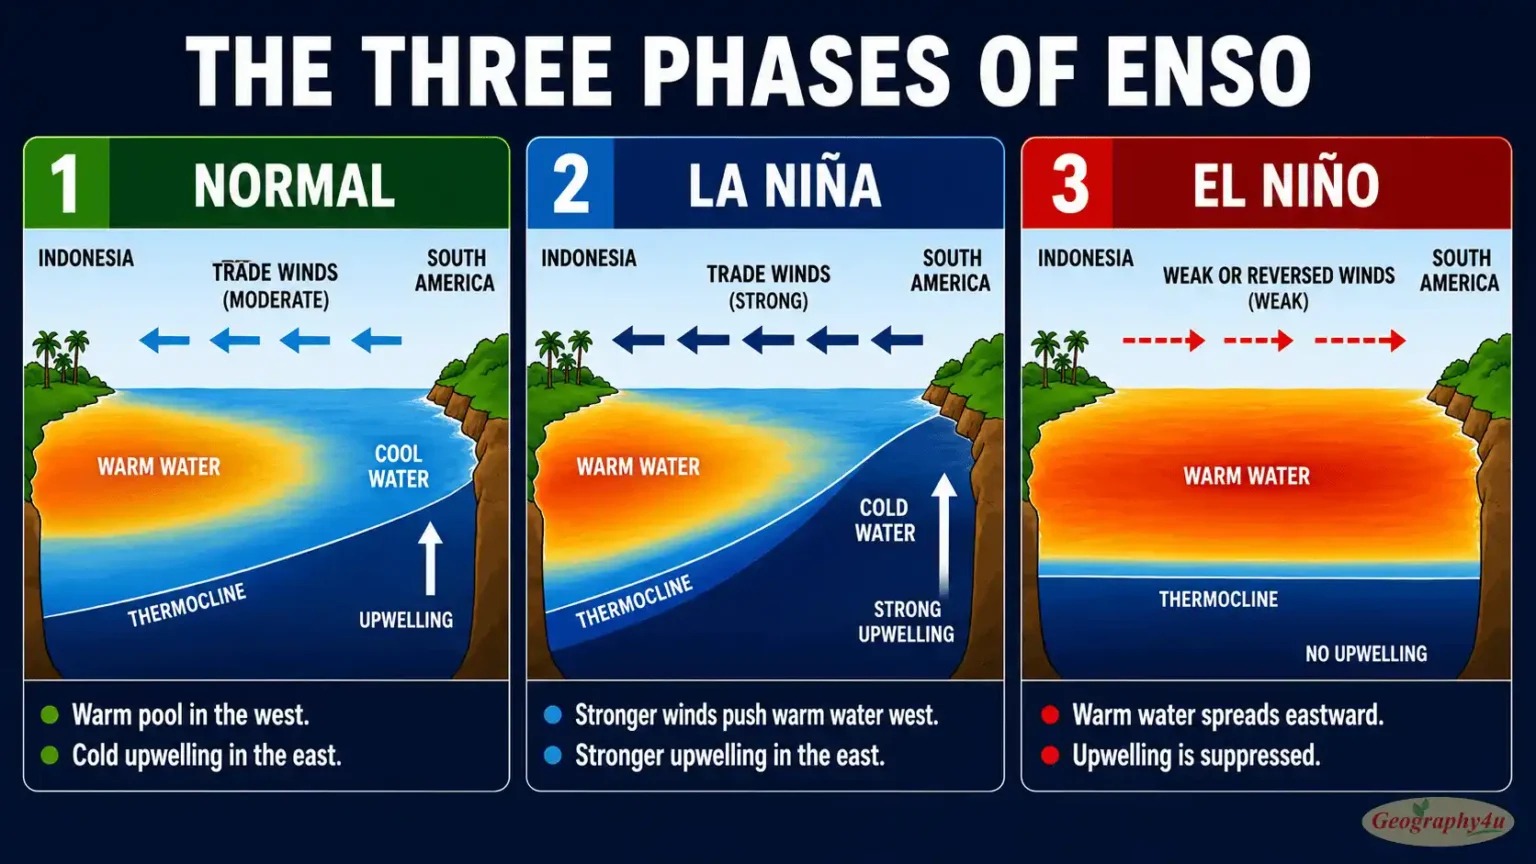
Under normal conditions, strong trade winds blow from east to west across the tropical Pacific. These winds push warm surface water toward the western Pacific — near Indonesia, the Philippines, and Australia — piling it up in what meteorologists call the “warm pool.” This leaves the eastern Pacific, near the coast of South America, relatively cool, because cold, nutrient-rich water rises from the deep ocean to replace the surface water that has been pushed westward. This cold upwelling is what makes the fishing grounds off Peru and Ecuador so productive.
During an El Niño event, the trade winds weaken dramatically — and sometimes reverse. Without the winds pushing warm water westward, it sloshes back toward the center and east of the Pacific. The eastern Pacific warms by 1°C to 3°C or more above normal. The cold upwelling along South America slows or stops. And the entire atmospheric circulation pattern over the Pacific — which depends on where the warm water is — gets disrupted.
That disruption is what makes El Niño so consequential. The Pacific Ocean covers roughly one-third of Earth’s surface. When you rearrange the heat distribution across one-third of the planet, the atmosphere everywhere responds.
El Niño = warm water shifts eastward in the Pacific. This single change disrupts weather patterns across the entire planet.
What Is La Niña? (The Opposite Phase)
La Niña — Spanish for “the girl child” — is the opposite of El Niño. During La Niña, the trade winds strengthen beyond their normal intensity, pushing even more warm water toward the western Pacific. The eastern Pacific becomes unusually cold. Upwelling along South America intensifies, bringing more cold, nutrient-rich water to the surface.
La Niña’s weather impacts are roughly the mirror image of El Niño’s:
| Impact | El Niño | La Niña |
|---|---|---|
| Indian Monsoon | Weakened — drought risk | Strengthened — flood risk |
| Atlantic Hurricanes | Suppressed — fewer storms | Enhanced — more storms |
| Australia | Drought, bushfire risk | Flooding, cyclone risk |
| South America (west coast) | Flooding in Peru/Ecuador | Drought in Peru/Ecuador |
| US Winter | Wet/cool south, warm north | Cold/snowy north, dry south |
| Global Temperature | Temporarily higher | Temporarily lower |
| East Africa | Wetter — flood risk | Drier — drought, famine risk |
| Pacific Typhoons | Shift eastward | Shift westward, more frequent |
La Niña events tend to last longer than El Niño events — sometimes persisting for two or three consecutive years (a “double-dip” or “triple-dip” La Niña). The most recent La Niña stretched from 2020 to early 2023, one of the longest on record. It was directly responsible for the record-breaking 2020 Atlantic hurricane season (30 named storms) and the devastating Australian floods of 2022.
The ENSO Cycle: How El Niño and La Niña Alternate
El Niño and La Niña are not separate phenomena. They are the warm and cool phases of a single oscillating system called ENSO — the El Niño-Southern Oscillation. ENSO is the most powerful year-to-year climate fluctuation on Earth.
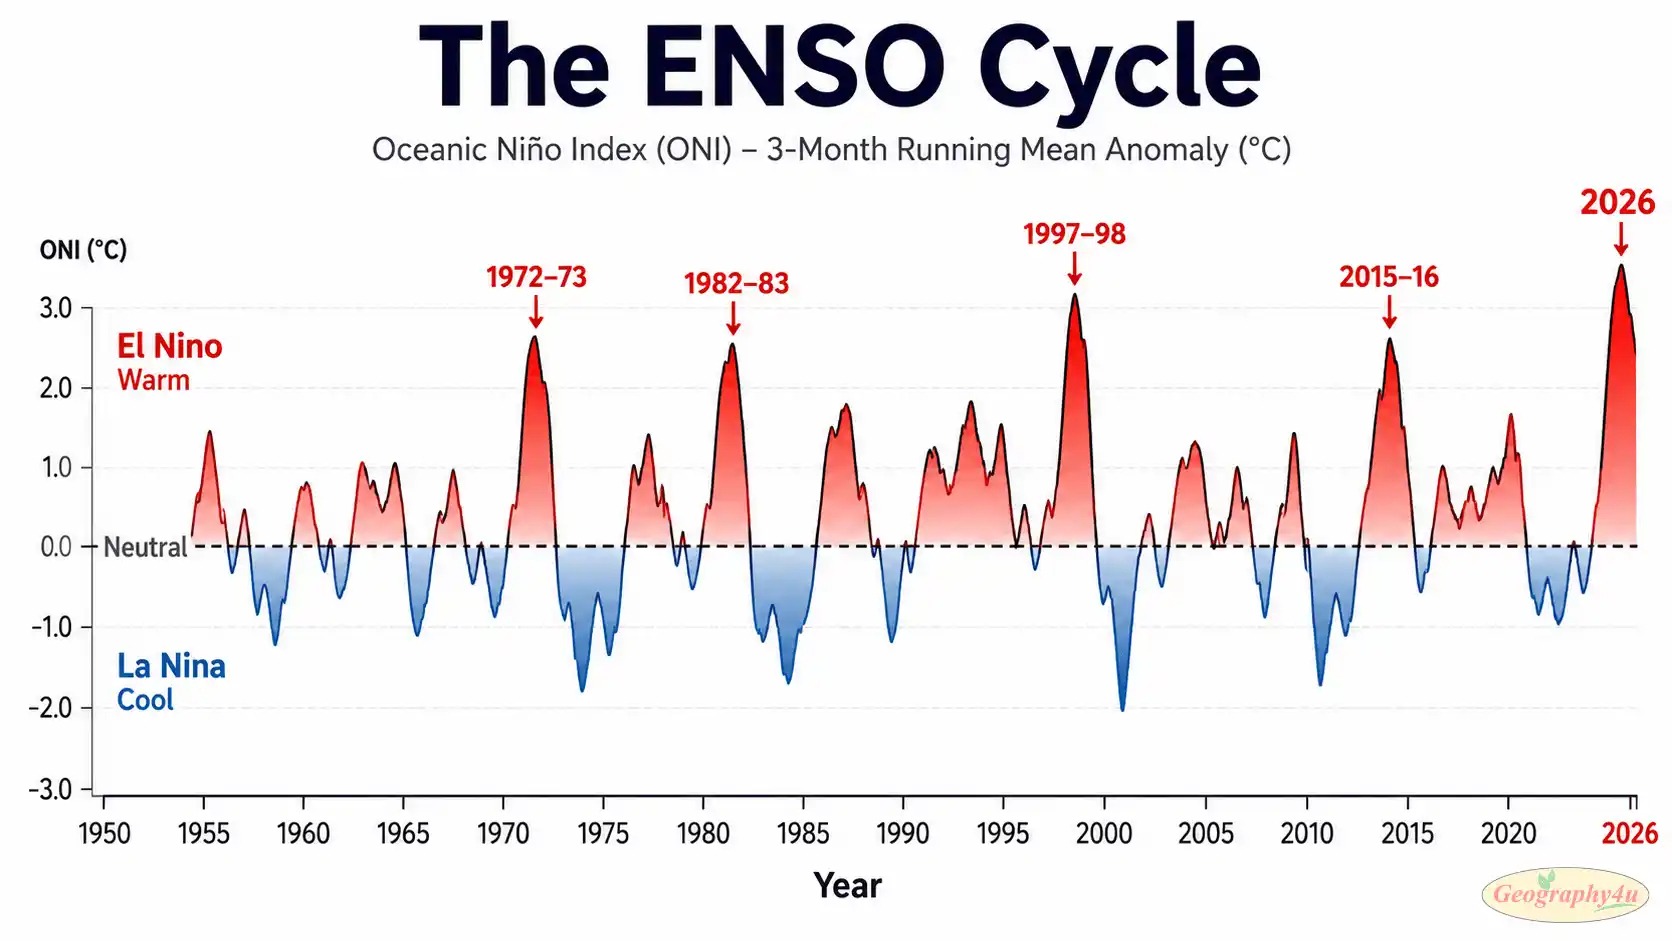
The cycle works like this: the tropical Pacific swings between warm (El Niño), cool (La Niña), and neutral phases. Each phase typically lasts 9 to 12 months, though La Niña can persist for multiple years. The full cycle from one El Niño to the next takes roughly 2 to 7 years — though the spacing is irregular and sometimes unpredictable.
Scientists measure ENSO using several tools. The most commonly cited is the Oceanic Niño Index (ONI), which tracks sea surface temperature anomalies in the Niño 3.4 region — a patch of the central Pacific between 5°N-5°S and 170°W-120°W. When the ONI exceeds +0.5°C for five consecutive overlapping three-month periods, it is officially classified as an El Niño event. When it drops below -0.5°C for the same duration, it is a La Niña event.
The thresholds for intensity are:
| Classification | ONI Value | Example |
|---|---|---|
| Weak El Niño | +0.5 to +0.9°C | 2018-19 |
| Moderate El Niño | +1.0 to +1.4°C | 2009-10 |
| Strong El Niño | +1.5 to +1.9°C | 1972-73 |
| Very Strong / “Super” | +2.0°C or higher | 1982-83, 1997-98, 2015-16, 2026? |
The 2026 event is currently tracking toward the “Very Strong / Super” category. As of July 2026, sea surface temperatures in the Niño-1+2 zone (the easternmost monitoring region, off the South American coast) have reached +2.7°C above normal — already in record territory.
The Walker Circulation: The Engine Behind ENSO
To understand why El Niño affects weather thousands of kilometers from the Pacific, you need to understand the Walker Circulation — the atmospheric engine that connects the Pacific to the rest of the world.
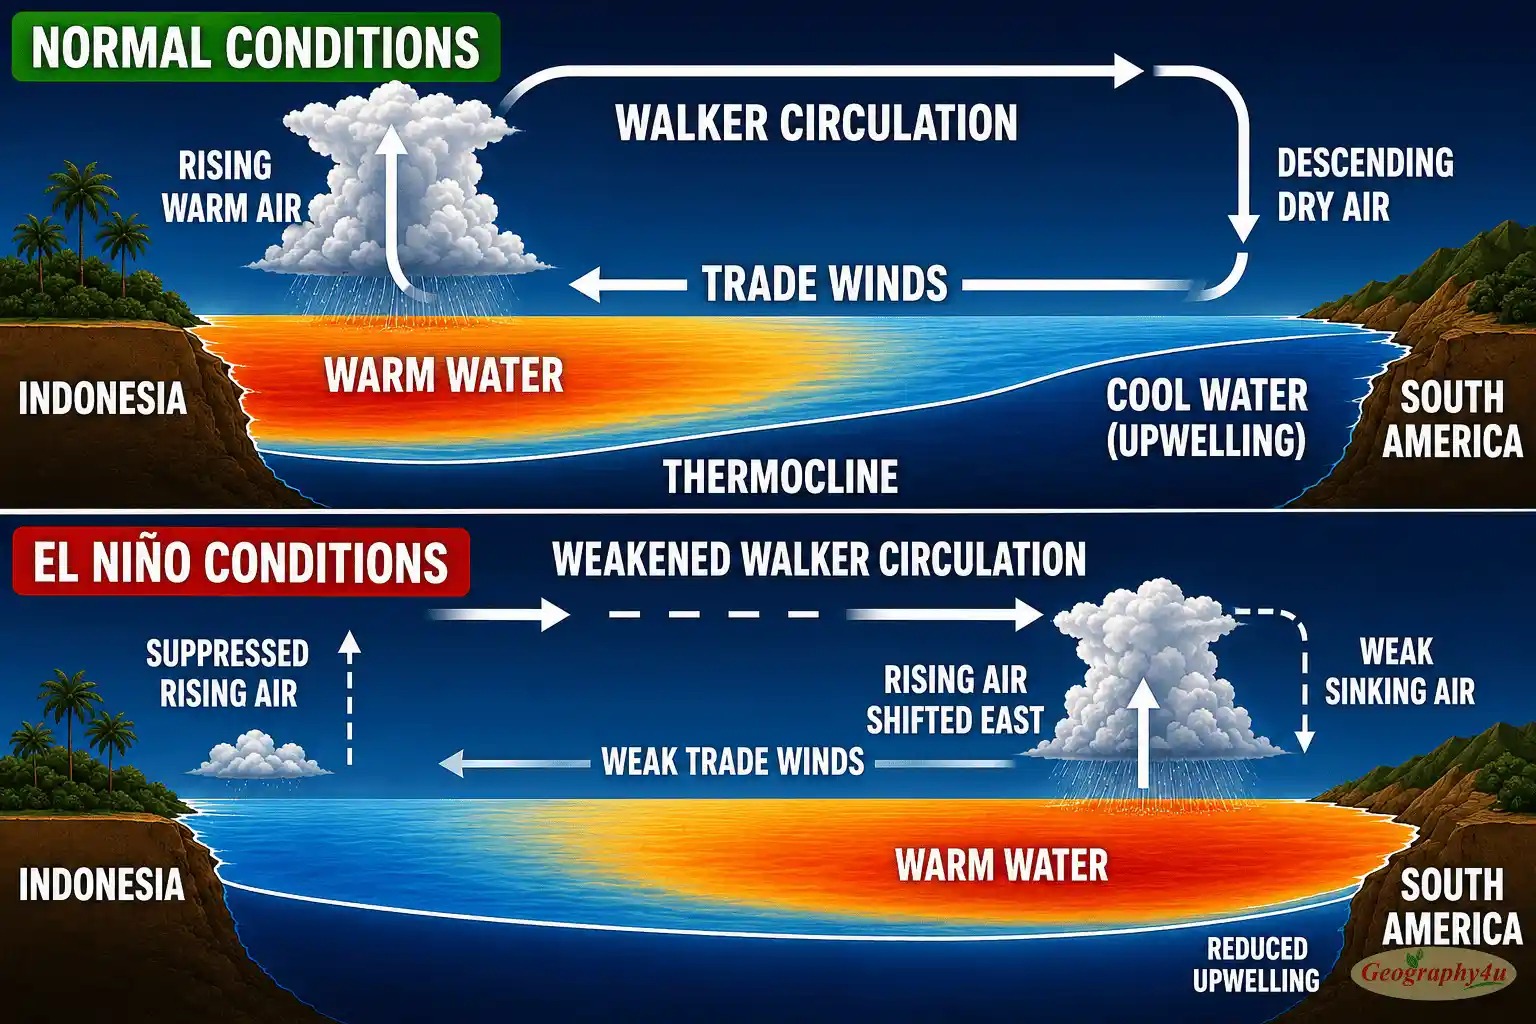
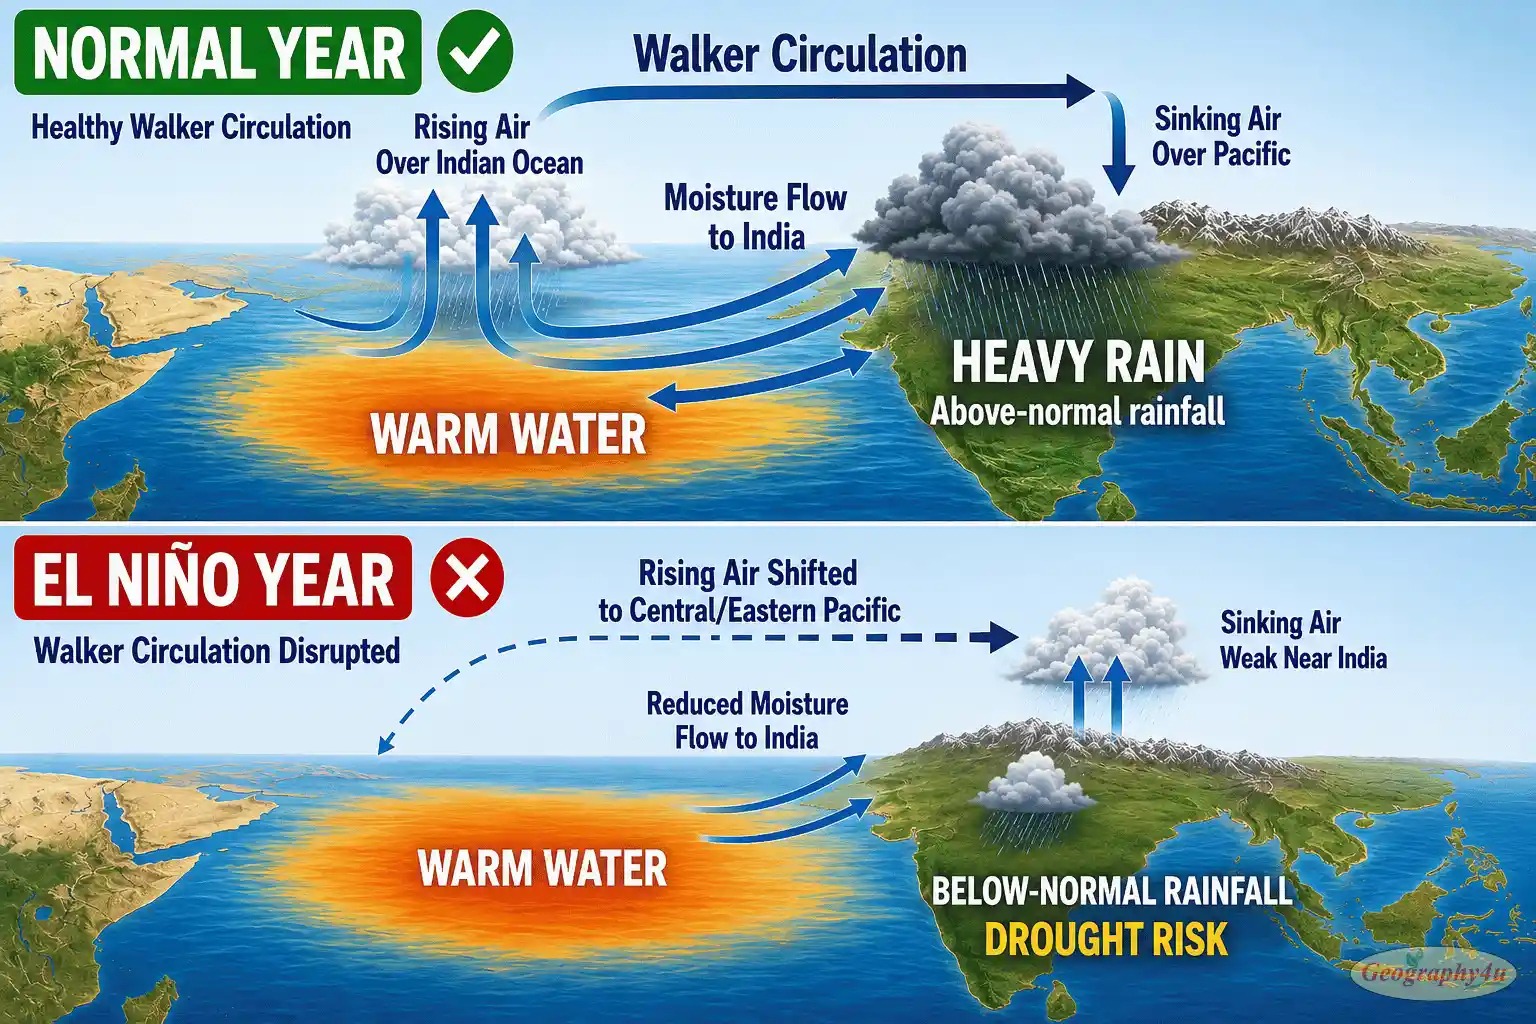
Under normal conditions, the Walker Circulation is a massive east-west loop of air across the tropical Pacific. Warm, moist air rises over the western Pacific warm pool (near Indonesia). It travels eastward at high altitude across the Pacific. It descends over the cooler eastern Pacific (near South America). And it returns westward at the surface as the trade winds, completing the loop.
This loop is self-reinforcing: the trade winds push warm water west, which keeps the western Pacific warm, which sustains the rising air that drives the trade winds. It is a stable, powerful, planet-sized atmospheric circuit.
During El Niño, this circuit breaks down. The warm water shifts eastward, so the rising air shifts eastward too. The trade winds weaken because the pressure gradient that drives them has changed. The entire Walker Circulation weakens, fragments, or in extreme cases, reverses direction.
This is the mechanism through which El Niño reaches beyond the Pacific. The Walker Circulation is connected to atmospheric circulation patterns over the Indian Ocean, the Atlantic, and even the polar regions. When the Walker Circulation weakens, these connected patterns shift — changing where rain falls, where droughts form, and where hurricanes can and cannot develop.
Related read: How the Walker Circulation Drives the Indian Monsoon →
The Southern Oscillation: The Atmospheric Half
The “SO” in ENSO stands for Southern Oscillation — the atmospheric component of the cycle. While El Niño describes what happens in the ocean (warming), the Southern Oscillation describes what happens in the atmosphere (pressure shifts).
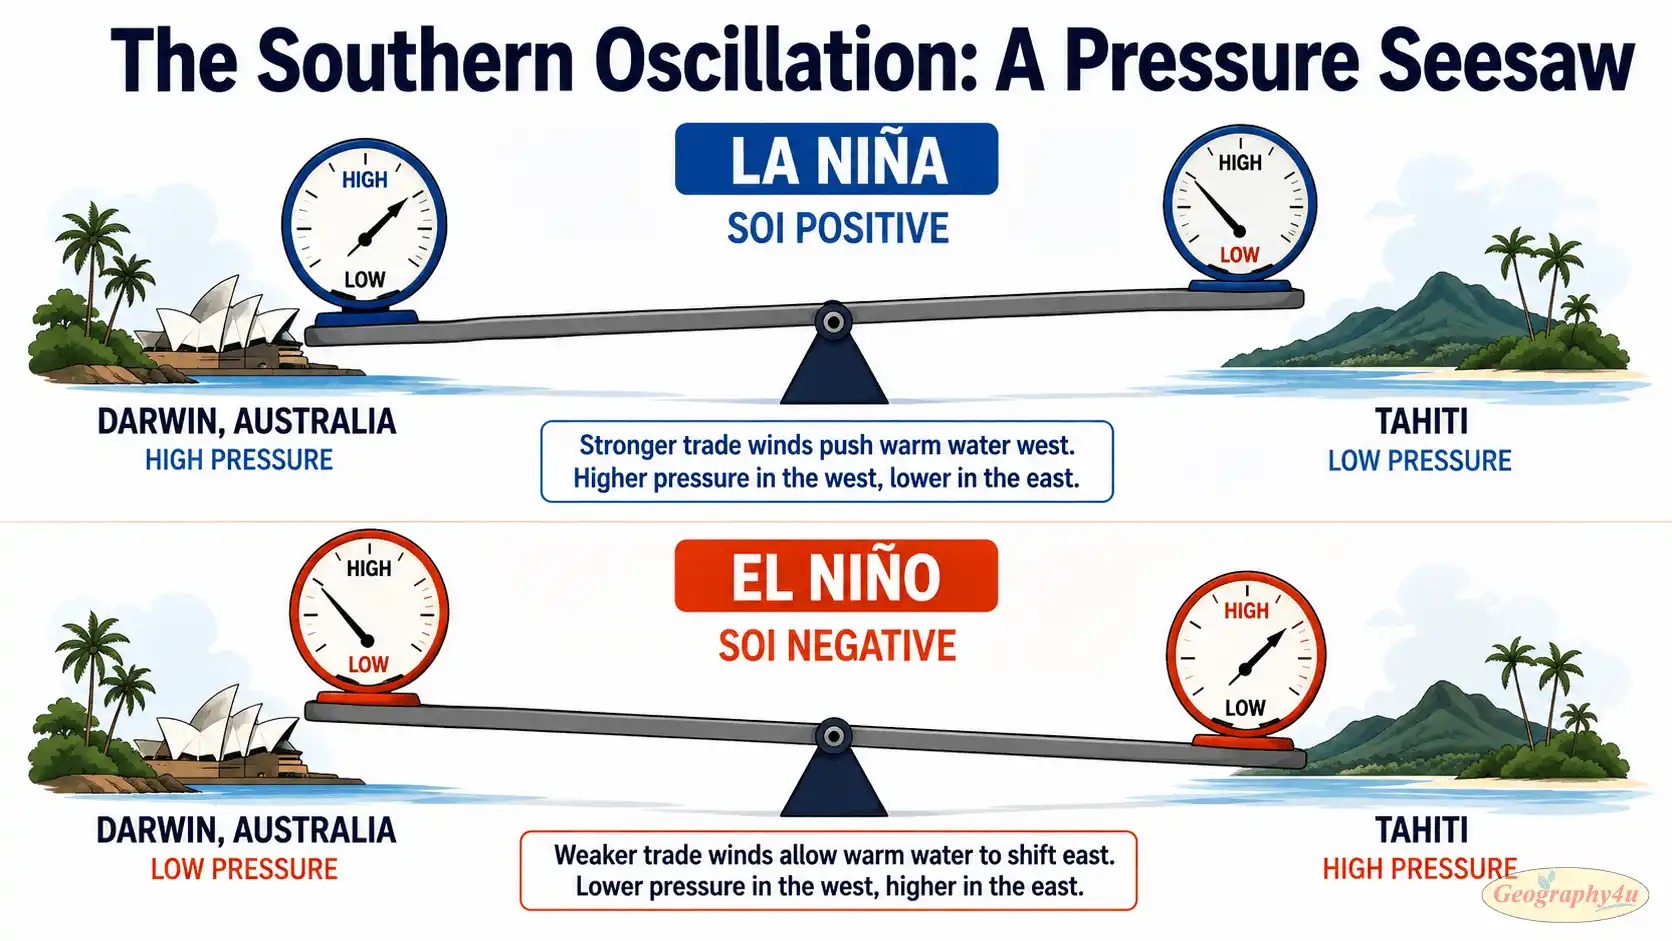
The Southern Oscillation is a seesaw in atmospheric pressure between the western and eastern Pacific. Meteorologists measure it using two weather stations on opposite sides of the Pacific: Darwin, Australia (western Pacific) and Tahiti (eastern Pacific). The difference in pressure between these two stations is the Southern Oscillation Index (SOI).
When pressure is lower at Tahiti and higher at Darwin, the SOI is negative — indicating El Niño conditions. When pressure is higher at Tahiti and lower at Darwin, the SOI is positive — indicating La Niña conditions. The SOI is updated monthly and is one of the primary tools used to track ENSO evolution.
The key insight of ENSO theory is that the ocean warming (El Niño) and the atmospheric pressure shift (Southern Oscillation) are not separate events — they are two faces of the same coupled ocean-atmosphere system. Warm water causes the atmosphere to shift, and the atmospheric shift reinforces the ocean warming, in a feedback loop that amplifies until it eventually overshoots and reverses.
How El Niño Affects Weather Worldwide
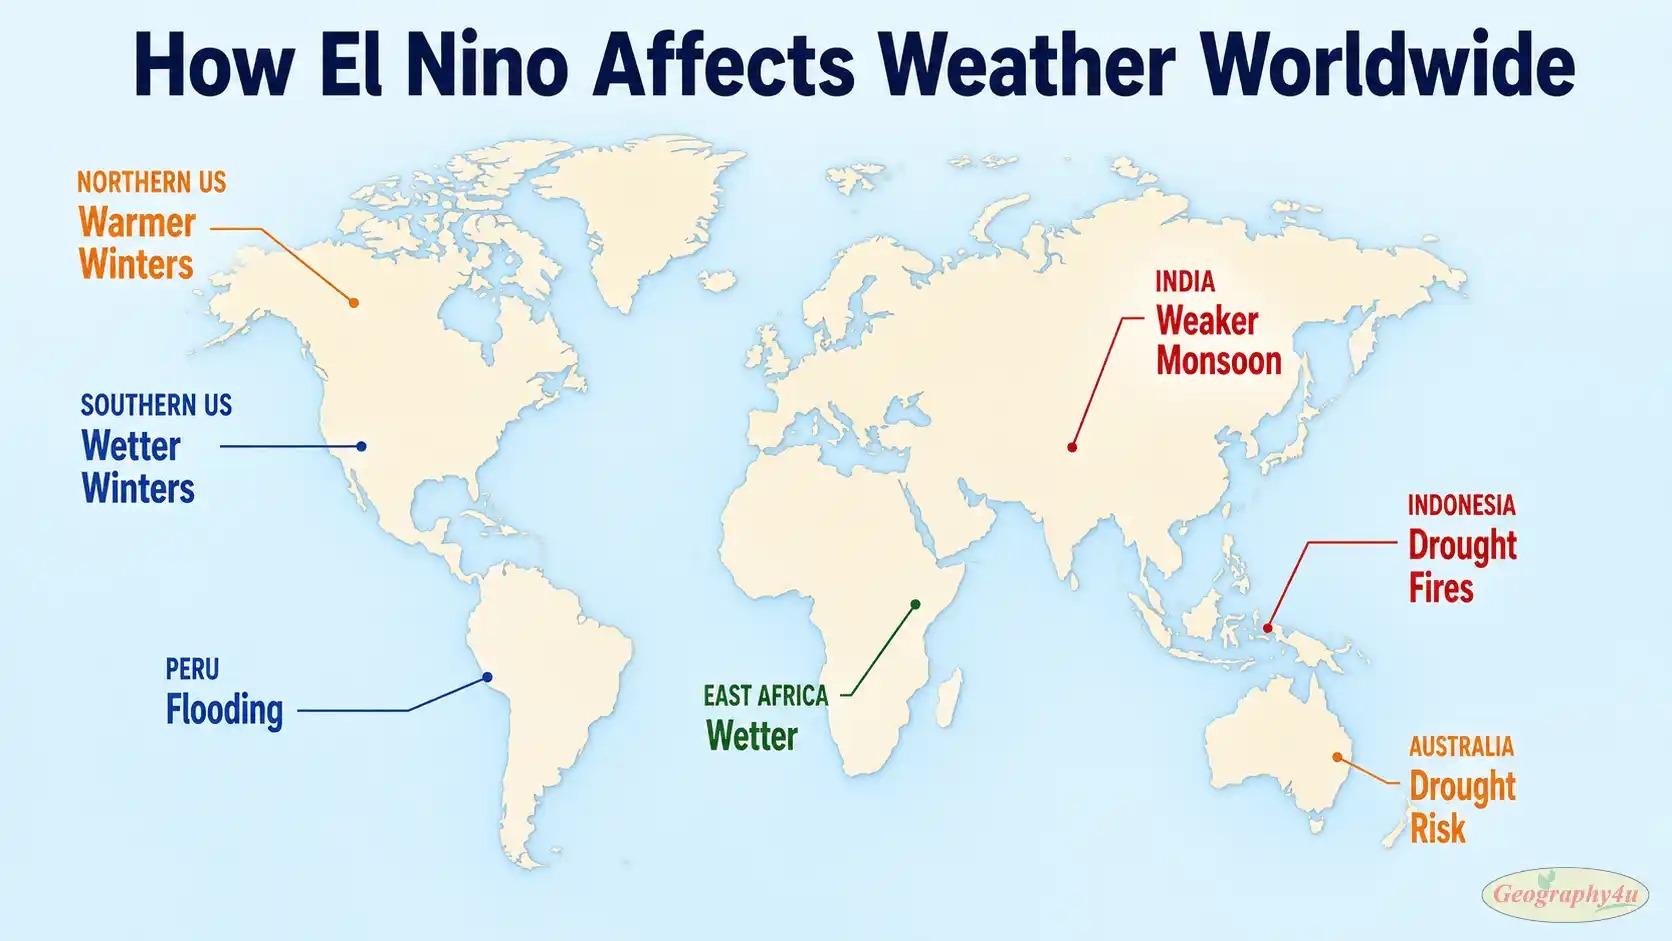
El Niño’s reach extends far beyond the Pacific. Through a chain of atmospheric connections called teleconnections, a patch of warm water near the equator can alter weather patterns on every inhabited continent.
United States
Strong El Niño winters typically bring wetter, cooler conditions to the southern tier states (California, Texas, Florida) and warmer, drier conditions to the northern states (Pacific Northwest, Great Lakes, Upper Midwest). California, in particular, often benefits from El Niño rainfall — the 1997-98 event brought devastating mudslides to southern California but also helped replenish drought-depleted reservoirs. The 2026-27 winter may follow a similar pattern.
South America
Peru and Ecuador experience above-normal rainfall and flooding during El Niño — sometimes catastrophically. The anchovy fishing industry collapses as warm water replaces the cold, nutrient-rich upwelling. Southern Brazil also tends to receive above-normal rainfall.
Australia
El Niño is synonymous with drought in Australia. Reduced rainfall across eastern and northern Australia increases bushfire risk, stresses agricultural output, and lowers river flows. The 1982-83 El Niño contributed to the Ash Wednesday bushfires, one of the worst fire disasters in Australian history. The 2026 event is already prompting Australian water authorities to issue drought-preparedness advisories.
Southeast Asia and Indonesia
Drier conditions prevail across Indonesia, the Philippines, and mainland Southeast Asia. The 2015-16 El Niño fueled catastrophic Indonesian wildfires that produced a toxic haze affecting 40 million people across six countries. Reduced rice production across the region drives up global rice prices.
East Africa
Counterintuitively, East Africa (Kenya, Somalia, Tanzania) tends to receive above-normal rainfall during El Niño. While this can benefit agriculture, it also triggers flooding and increases the risk of mosquito-borne diseases like malaria and dengue.
Global Temperature
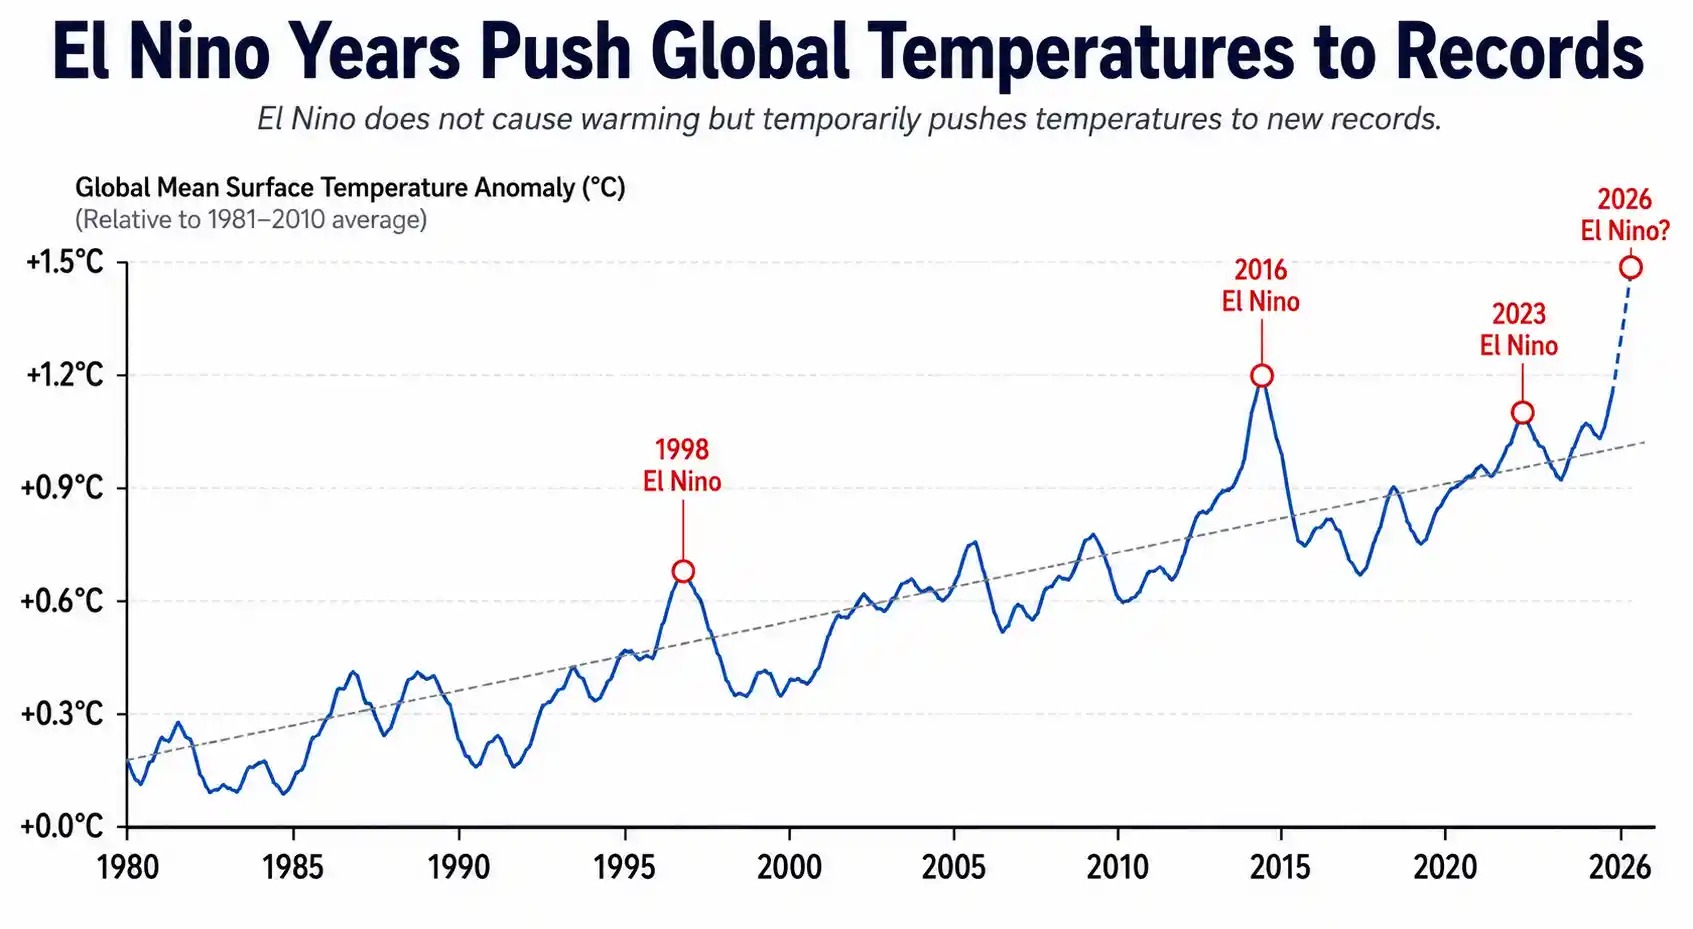
El Niño events temporarily boost global average temperatures by releasing vast amounts of stored ocean heat into the atmosphere. The three warmest years in the instrumental record at the time they were measured — 1998, 2016, and 2023 — all coincided with El Niño events. WMO scientist Alvaro Silva noted in July 2026: “We know that during El Niño years, the global temperatures normally reach record levels.” The 2026 event, if it reaches the projected intensity, could push 2026 or 2027 to a new record.
El Niño and the Indian Monsoon
For India’s 1.4 billion people, El Niño is not an abstract climate curiosity. It is an economic threat.
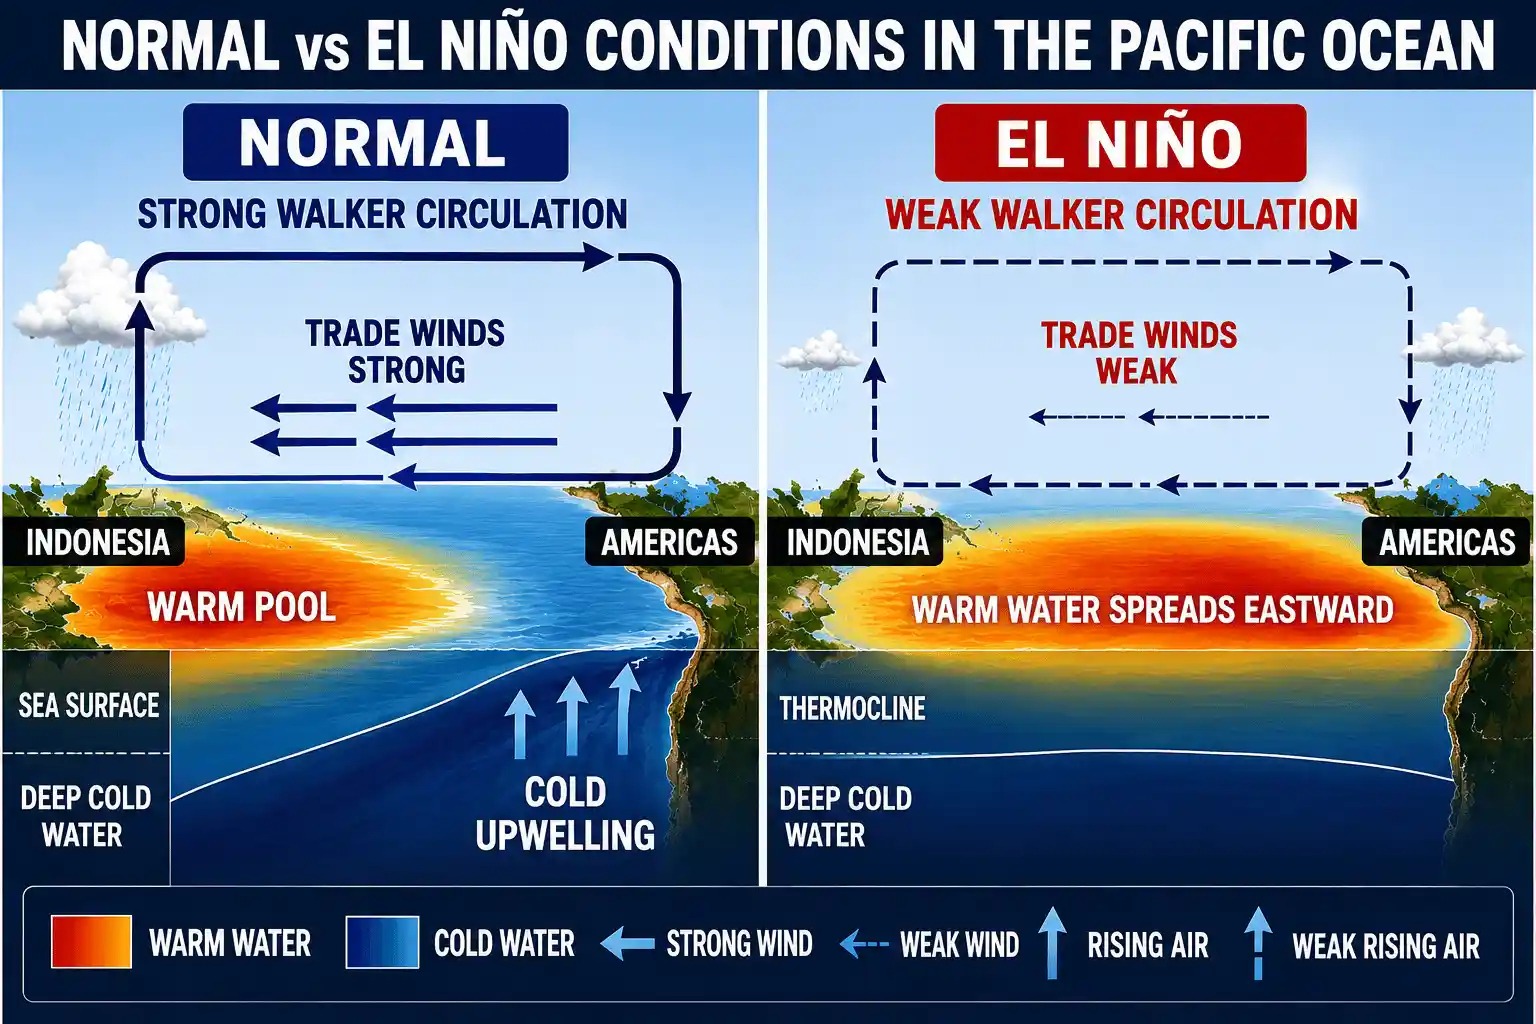
El Niño weakens the Indian Southwest Monsoon through a specific mechanism: it disrupts the Walker Circulation that drives moisture-laden winds from the Indian Ocean onto the subcontinent. When warm water shifts eastward in the Pacific, the ascending branch of the Walker Circulation shifts with it — away from the Indian Ocean. The pressure gradient between the Indian Ocean and the Asian landmass weakens, and less moisture is pulled into India.
The correlation is well-documented: of the 13 strongest El Niño events since 1950, 10 coincided with below-normal Indian monsoons. In 2026, the India Meteorological Department has forecast the monsoon at only 90% of the long-period average, with a 60% probability of a fully deficient season.
The consequences are immediate and concrete. Reduced monsoon rainfall means lower rice and sugarcane yields, higher food prices, reduced hydroelectric power generation, lower rural employment, and stress on India’s GDP growth. A 10% monsoon deficit can shave 0.5-1.0 percentage points off India’s GDP — measurable in tens of billions of dollars.
Deep dive: What Is a Monsoon? How Earth’s Largest Weather System Works →
El Niño and Atlantic Hurricanes
While El Niño weakens the Indian monsoon, it simultaneously suppresses Atlantic hurricane activity — through an entirely different mechanism.
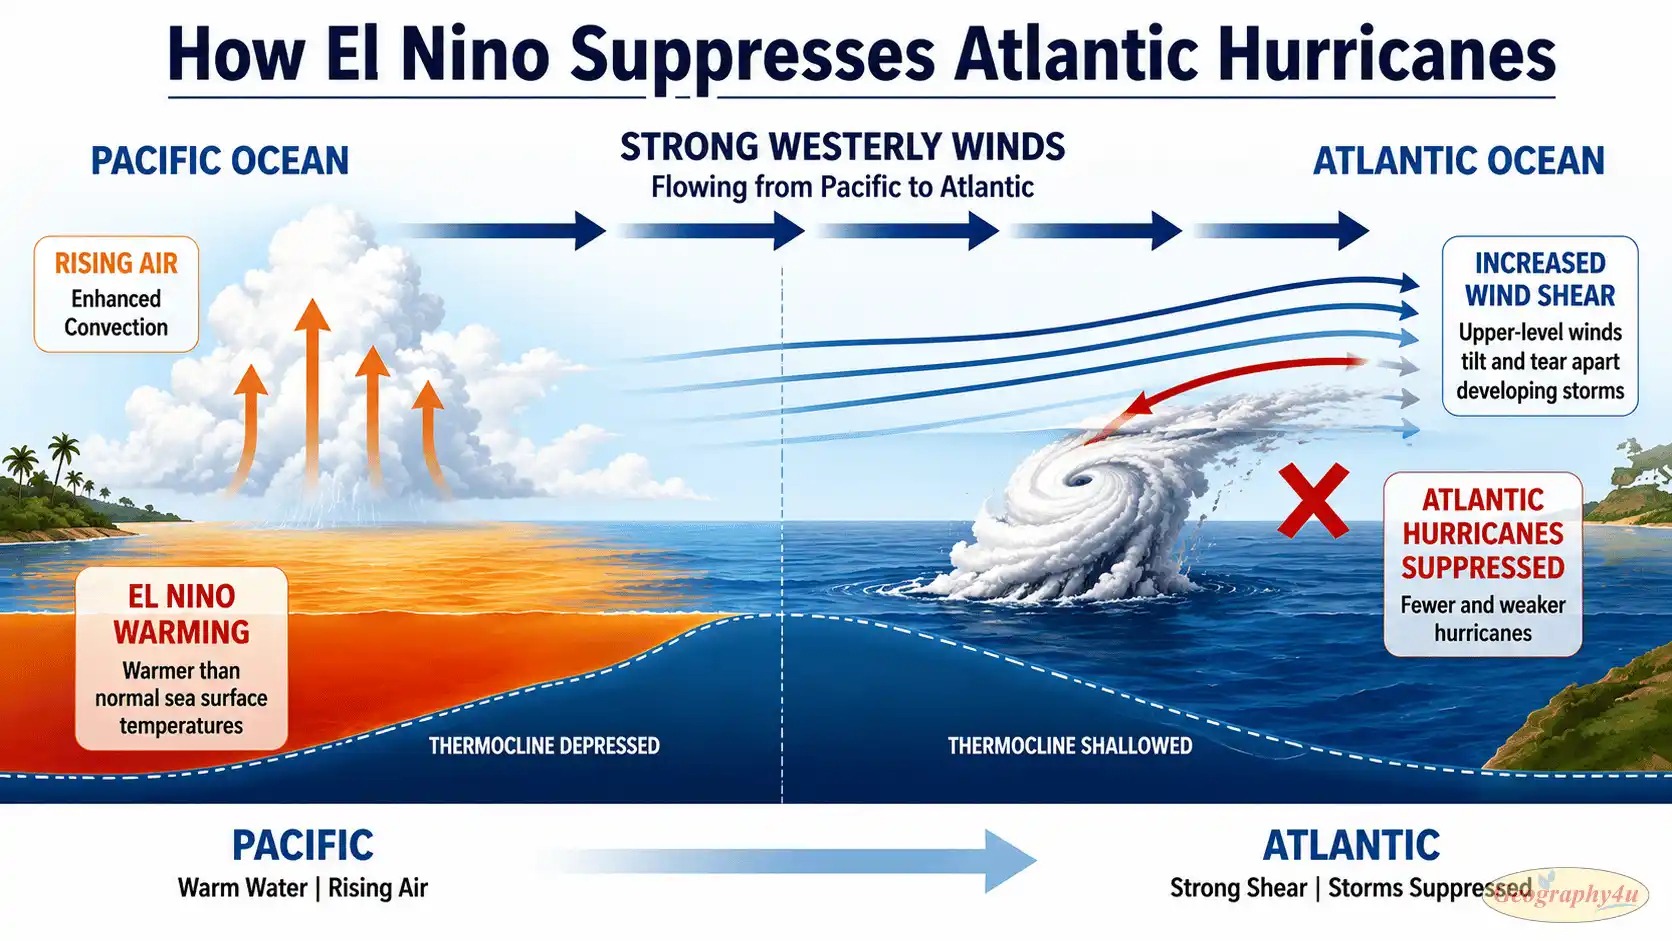
El Niño warms the central Pacific, which shifts the tropical atmospheric circulation pattern. This creates stronger upper-level westerly winds over the tropical Atlantic — increasing vertical wind shear. Wind shear is the difference in wind speed or direction between the lower and upper atmosphere, and it is the single most effective natural mechanism for destroying tropical storms before they can organize.
The numbers bear this out. NOAA’s original May 2026 outlook predicted 8-14 named storms, already below the 30-year average of 14. After the WMO’s July update confirmed rapid El Niño intensification, Colorado State University revised its forecast down to just 9 named storms and 1 major hurricane — one of the lowest forecasts in recent decades.
The irony is striking: the same climate pattern that is threatening India’s food supply is simultaneously protecting America’s East Coast from hurricanes. Same El Niño, opposite effects, opposite sides of the planet.
Deep dive: Hurricanes, Typhoons & Cyclones Explained →
The 2026 El Niño: Potentially the Strongest in a Century
The 2026 El Niño is developing faster and stronger than almost anyone predicted — and the speed of the forecast reversal is itself extraordinary.
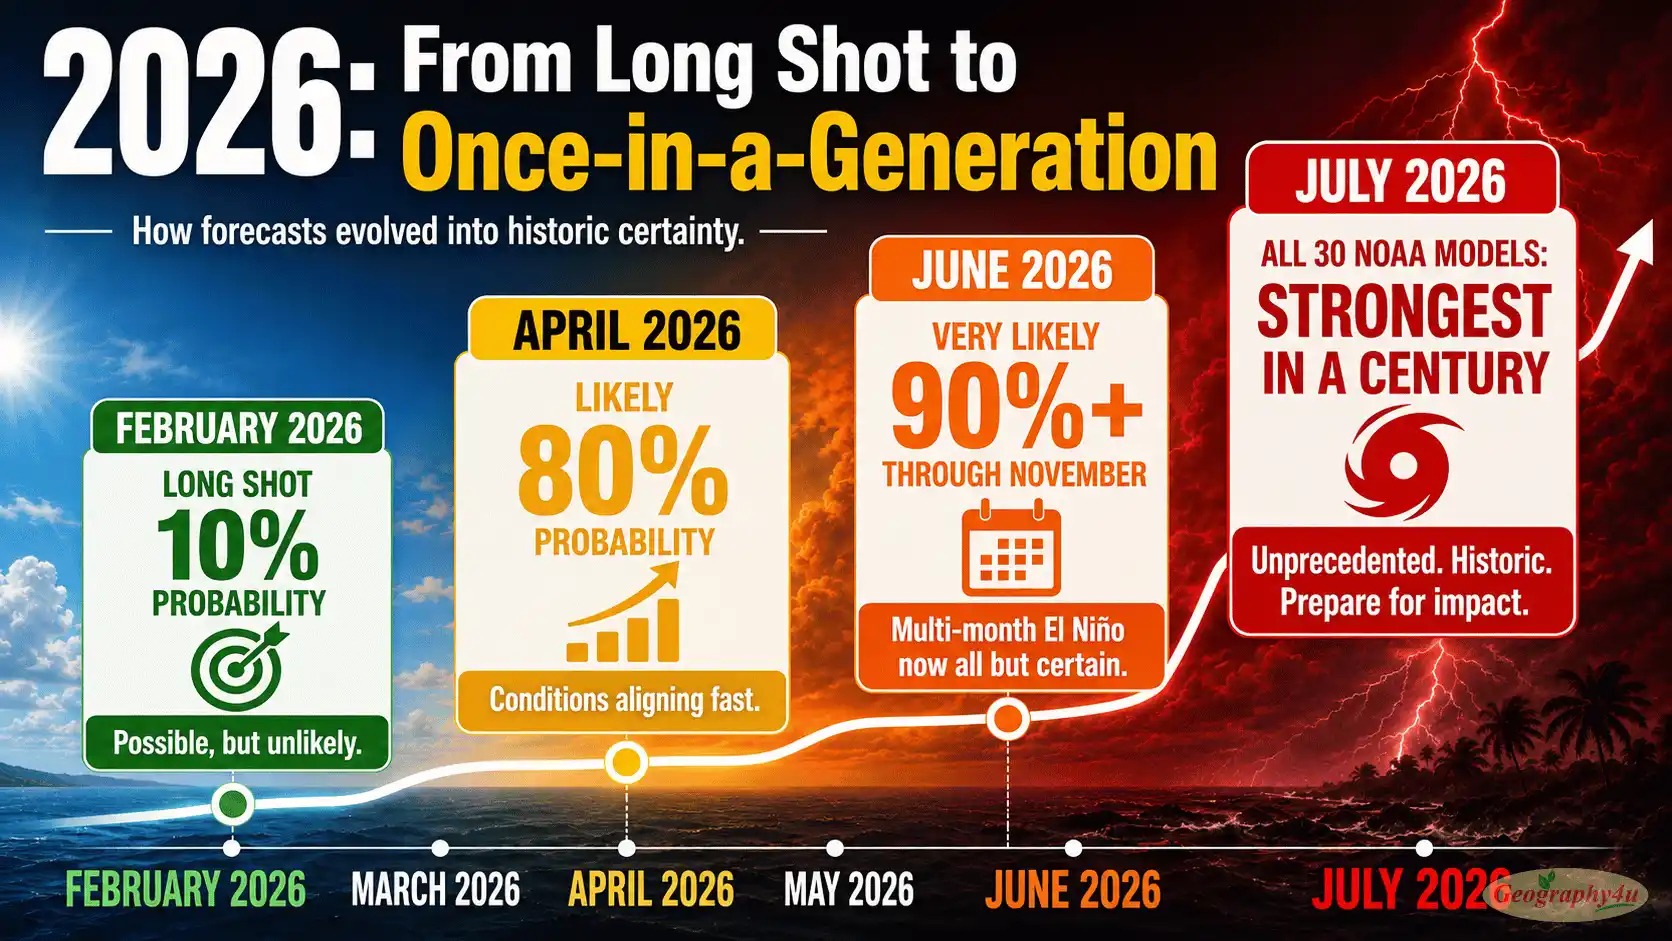
Here is how the forecast evolved in just five months:
| Date | Source | Assessment |
|---|---|---|
| Feb 2026 | WMO | 10% probability of El Niño for March-May. Neutral conditions favored. |
| Apr 23, 2026 | WMO | SSTs rising rapidly. El Niño likely from May-July. 80% probability for June-August. |
| May 29, 2026 | IMD | Indian monsoon forecast downgraded to 90% of LPA. 60% probability of deficient season. |
| Jun 2, 2026 | WMO | 80% likelihood June-August. 90%+ through November. Moderate to possibly strong. |
| Jul 2, 2026 | WMO | SST anomalies expected to exceed +2°C. “Most intense El Niño impacts in the historical record.” |
| Jul 3, 2026 | WMO | Rapid development into a strong El Niño July-September. “High confidence.” |
| Jul 2026 | NOAA GFDL | All 30 ensemble members: peak “at least competitive with the strongest events over the past century.” |
| Jul 8, 2026 | CSU | Hurricane forecast revised DOWN: 9 named storms, 1 major hurricane. |
From 10% probability in February to “potentially the strongest in a century” by July. NOAA’s 30 climate models unanimously agree: a historically strong El Niño is already underway.
What makes the 2026 event particularly notable is not just its projected strength but the speed of the transition. The Pacific went from a fading La Niña to a developing record El Niño in less than six months — a pace that caught even experienced forecasters off guard. The Niño-1+2 region, off the South American coast, has already reached +2.7°C above normal as of mid-July.
The peak is expected in late 2026 or early 2027. NOAA GFDL’s models project the El Niño will weaken through the Northern Hemisphere spring of 2027 — meaning the most intense global impacts (including the potential for record global temperatures) are still ahead.
Historical El Niño Events: 1972, 1982, 1997, 2015, and Now 2026
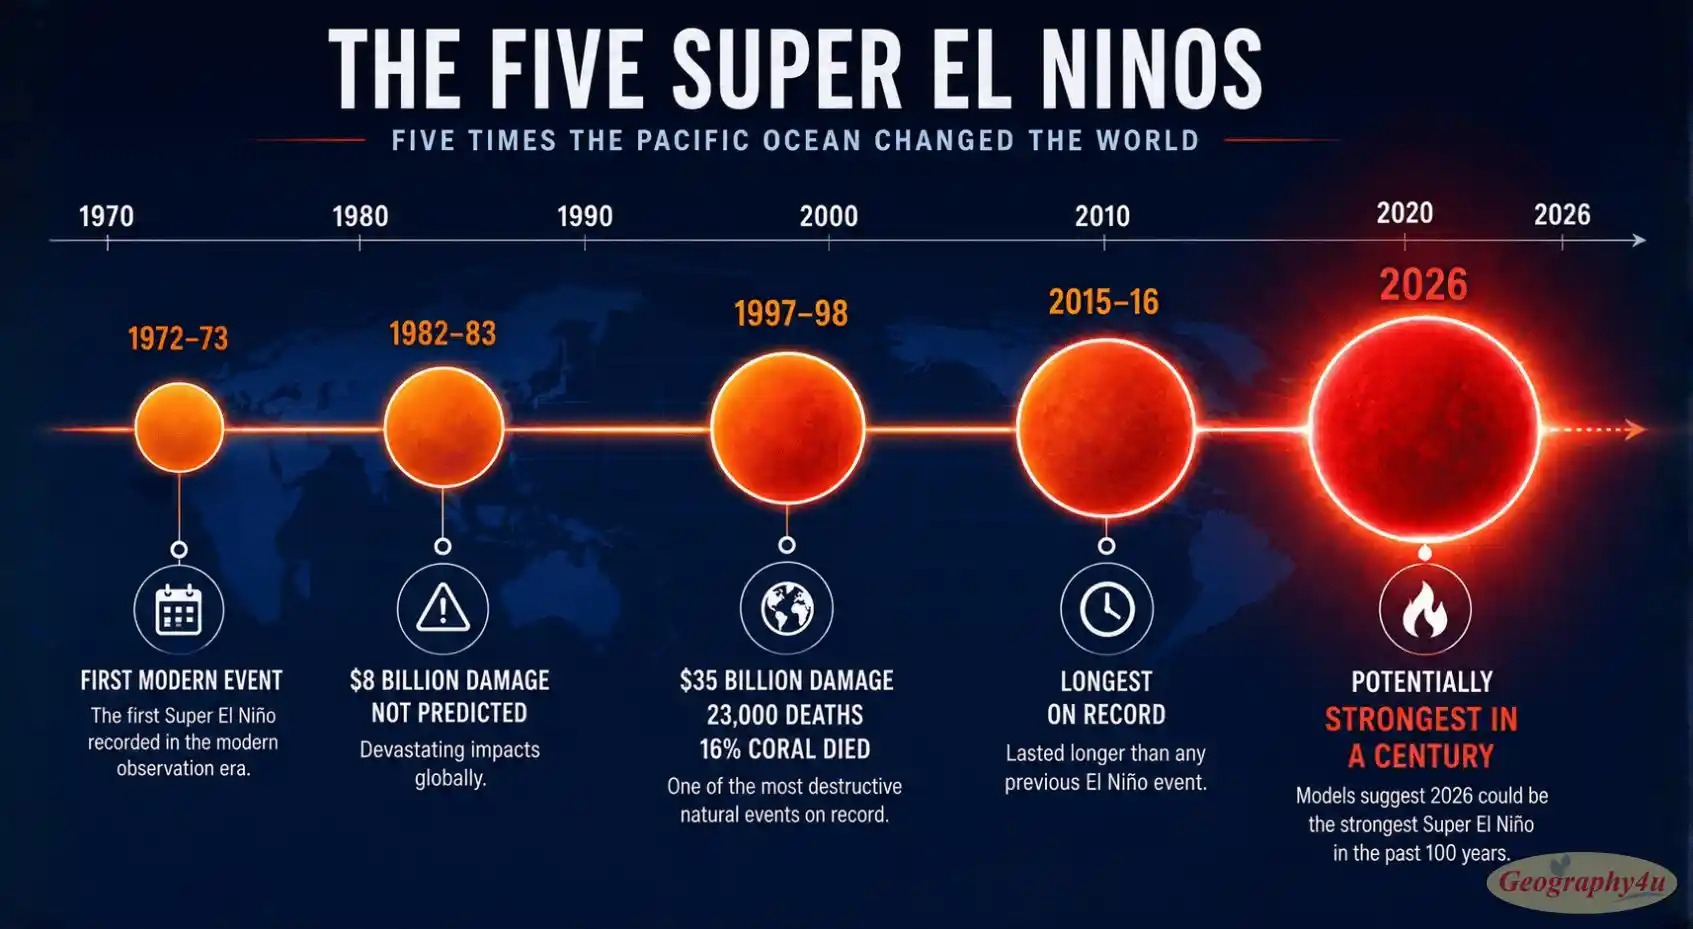
Four El Niño events in the past half-century have been strong enough to reshape global weather and leave lasting economic and humanitarian impacts. The 2026 event now appears poised to join — or surpass — this list.
1972-73: The First “Modern” El Niño
The first El Niño event to be widely studied. It devastated Peru’s anchovy fishing industry, contributed to a global food crisis, and helped spark the scientific effort to understand and predict ENSO.
1982-83: The Unexpected Giant
This event was not predicted — it developed faster than scientists could track with the monitoring systems available at the time. It caused an estimated $8 billion in damage worldwide: floods in Peru, drought in Australia and Indonesia, and the Ash Wednesday bushfires in Australia. It killed an estimated 2,000 people globally. The failure to predict it drove a massive expansion of Pacific Ocean monitoring systems.
1997-98: The “Super El Niño”
The strongest El Niño measured up to that point, with Niño 3.4 anomalies reaching +2.4°C. Estimated to have caused $35 billion in damage and 23,000 deaths worldwide. Floods destroyed 10% of Peru’s road network. Drought in Indonesia contributed to forest fires that burned 9.7 million hectares. An estimated 16% of the world’s coral reefs died from heat stress. The 1998 global temperature record stood for nearly 20 years.
Related: Why coral reefs dying really around the world?
2015-16: The Longest and Strongest on Record
Comparable in peak intensity to 1997-98 but longer-lasting and larger in geographic extent. Coincided with record global temperatures in 2015 and 2016. Fueled catastrophic Indonesian wildfires (2.6 million hectares burned, toxic haze across six countries). Contributed to drought in Ethiopia, the Caribbean, and southern Africa. Produced record hurricane activity in the central North Pacific.
2026: The Event Still Unfolding
If NOAA GFDL’s projections hold, the 2026 event will at minimum rival 1997-98 and 2015-16 — and could exceed them. The combination of the fastest transition speed on record, an already-advanced Niño-1+2 anomaly of +2.7°C, and the unanimous agreement of 30 ensemble model members makes this one of the most closely watched climate events of the 21st century.
How Scientists Predict El Niño
The Pacific Ocean is monitored by one of the most extensive observing systems ever deployed for a single climate phenomenon.
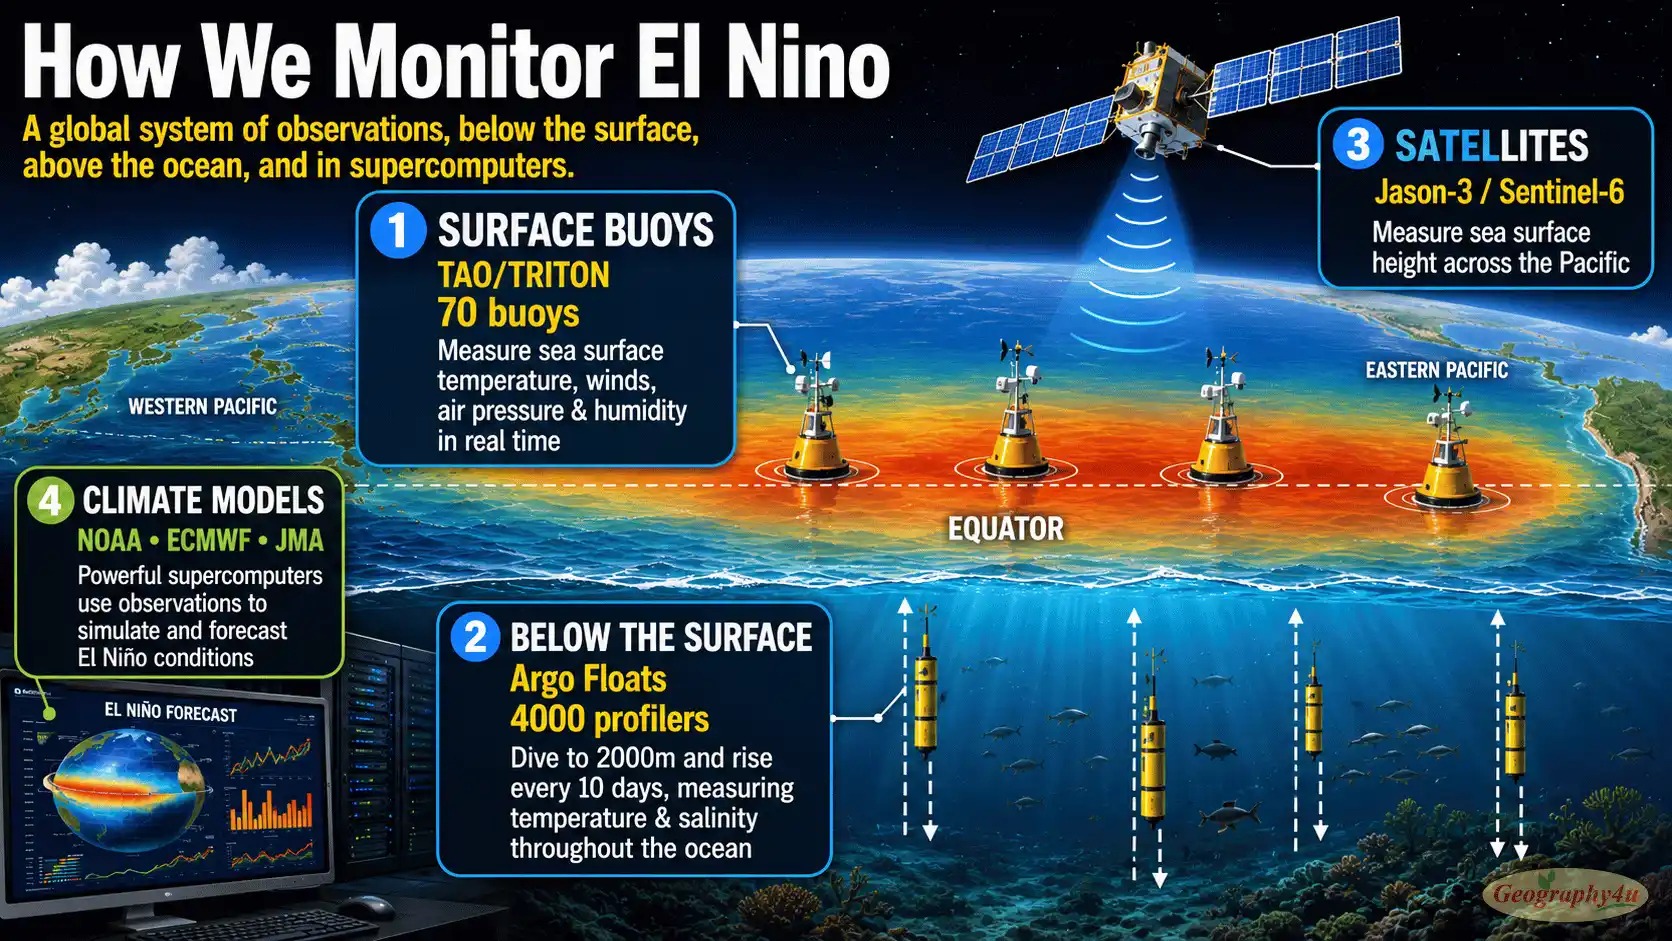
The TAO/TRITON buoy array — a network of approximately 70 moored ocean buoys stretching across the tropical Pacific from 8°N to 8°S, 137°E to 95°W. Each buoy measures sea surface temperature, wind speed and direction, air temperature, humidity, and ocean temperature at multiple depths. The data is transmitted via satellite in real time.
Argo floats — a global network of nearly 4,000 autonomous profiling floats that drift through the ocean, periodically diving to 2,000 meters and measuring temperature and salinity on the way back up. About 900 of these operate in the Pacific, providing subsurface temperature profiles that are critical for detecting the heat buildup that precedes El Niño events.
Satellites — Jason-3 and Sentinel-6 measure sea surface height with millimeter precision. Since warm water expands, El Niño causes the sea surface in the eastern Pacific to rise measurably — sometimes by 20-30 centimeters. This height change is detectable months before surface temperature anomalies become apparent.
Climate models — NOAA, ECMWF (European Centre), JMA (Japan), and other centers run coupled ocean-atmosphere models that simulate the evolution of ENSO. These models are initialized with the latest observational data and run forward 12-18 months. Modern models can typically predict El Niño onset 6-9 months in advance — though the 2026 event’s rapid acceleration showed the limits of this capability.
Despite these advances, precise intensity prediction remains the biggest challenge. Whether an event will peak as moderate or super-strong is often uncertain until just weeks before the peak.
El Niño and Climate Change: Are They Getting Stronger?
This is one of the most debated questions in climate science, and the honest answer is: we don’t know yet, but there are concerning signals.
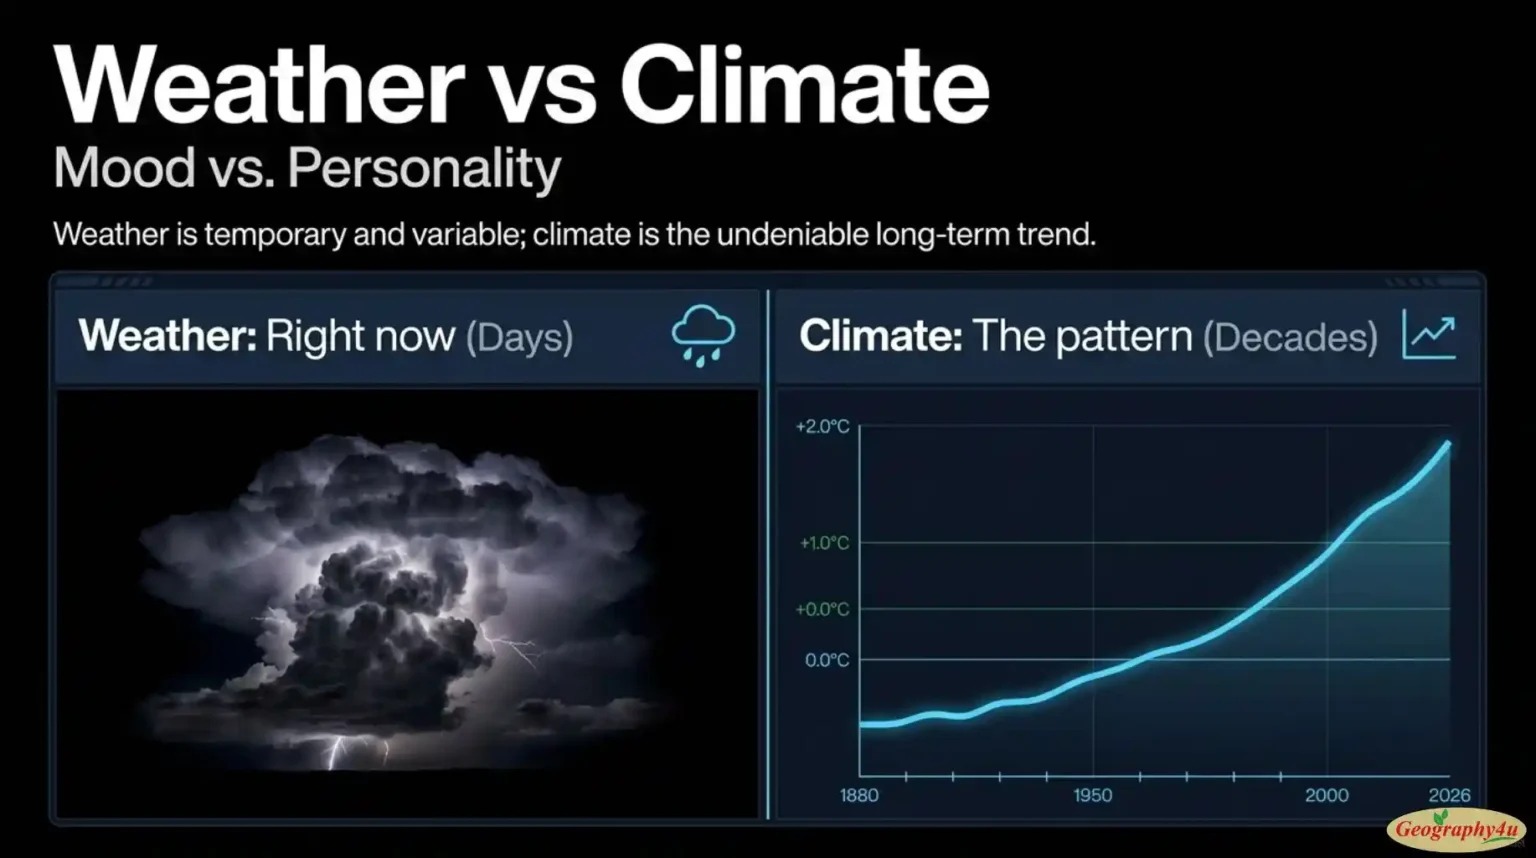
El Niño is not caused by climate change. ENSO has been cycling for thousands — likely millions — of years, long before humans began altering the atmosphere. Coral records and ice cores show evidence of ENSO activity stretching back at least 130,000 years.
However, there are three ways climate change could be altering ENSO:
1. Higher baseline temperatures. The Pacific Ocean is already warmer than its pre-industrial average. An El Niño event that pushes temperatures 2°C above a warmer baseline reaches a higher absolute temperature than the same event would have a century ago — potentially triggering more extreme impacts.
2. More extreme events. Some modeling studies suggest that the frequency of “super” El Niños may increase as the Pacific warms. A 2014 study in Nature Climate Change projected that extreme El Niño events could roughly double in frequency under high-emission scenarios.
3. Faster transitions. The 2026 event’s rapid development — from 10% probability to potentially record-setting in five months — may become more common as ocean heat content increases. More stored heat means the Pacific can transition more quickly from one state to another.
But certainty is elusive. The observational record of ENSO is short (reliable measurements only since the 1950s), the natural variability is enormous, and the models disagree on details. What is clear is that El Niño events in a warmer world will produce more extreme absolute temperatures, heavier rainfall events, and higher sea level impacts — because they are building on top of a higher baseline.
Frequently Asked Questions
What is El Niño in simple terms?
El Niño is a climate pattern that occurs when surface water in the central and eastern Pacific Ocean becomes abnormally warm. This warming disrupts atmospheric circulation, changing weather worldwide — weakening monsoons in India, suppressing Atlantic hurricanes, bringing floods to South America, and pushing global temperatures to record highs. Events typically occur every 2 to 7 years.
What is the difference between El Niño and La Niña?
They are opposite phases of the ENSO cycle. El Niño involves unusually warm Pacific water and weakened trade winds. La Niña involves unusually cool Pacific water and strengthened trade winds. Their weather impacts are roughly opposite: El Niño suppresses monsoons and Atlantic hurricanes, while La Niña enhances both.
How strong will El Niño 2026 be?
As of July 2026, NOAA’s GFDL reports that all 30 of its climate model simulations produce a peak strength “at least competitive with the strongest events over the past century.” Sea surface temperatures in the Niño-1+2 zone have already reached +2.7°C above normal. WMO projects anomalies will exceed +2°C before the winter peak — associated with the most intense impacts in the historical record.
How does El Niño affect the United States?
Strong El Niño winters bring wetter, cooler conditions to the southern US (California, Texas, Florida) and warmer, drier conditions to the northern states. California often receives above-normal rainfall. The Atlantic hurricane season is suppressed due to increased wind shear.
How does El Niño affect India?
El Niño weakens India’s Southwest Monsoon by disrupting the Walker Circulation. Of the 13 strongest El Niño events since 1950, 10 coincided with below-normal monsoons. In 2026, IMD has forecast the monsoon at only 90% of normal, with a 60% chance of a fully deficient season.
Does El Niño cause global warming?
No. El Niño does not cause long-term global warming — that is driven by greenhouse gas emissions. However, El Niño temporarily boosts global temperatures by releasing stored ocean heat. The years 1998, 2016, and 2023 all set temperature records during El Niño events. The 2026 event could push 2026 or 2027 to new records as well.
How often does El Niño happen?
Every 2 to 7 years, lasting 9 to 12 months typically. Strong or “super” events (1982-83, 1997-98, 2015-16, 2026) occur roughly every 15-20 years.
What is the Walker Circulation?
A large-scale east-west atmospheric circulation loop across the tropical Pacific. Normally, air rises over the warm western Pacific, travels east at high altitude, descends over the cooler eastern Pacific, and returns westward as the trade winds. During El Niño, this loop weakens or reverses because the warm water shifts eastward.
What is the Southern Oscillation?
The atmospheric pressure seesaw between the western and eastern Pacific that accompanies El Niño. Measured by the SOI (Southern Oscillation Index), the pressure difference between Darwin, Australia and Tahiti. Negative SOI values indicate El Niño; positive values indicate La Niña.
Can we predict El Niño?
Yes, with increasing accuracy — typically 6 to 9 months in advance. However, the 2026 event showed the limits: as recently as February, WMO assigned only a 10% probability to El Niño, yet by July it had become potentially record-setting. Exact peak strength remains hard to predict.
Final Thoughts: The Pattern That Runs the World
El Niño is, in some ways, the most important climate pattern most people have never fully understood. A patch of warm water in the central Pacific — invisible from the surface, measurable only by instruments — can weaken monsoons that feed a billion people, suppress hurricanes that threaten entire coastlines, trigger droughts that cause famines, and push global temperatures past records that have stood for decades.
The 2026 event is unfolding now, in real time. By the time you read this, it may have intensified further. The peak is projected for late 2026 or early 2027, which means the most consequential impacts — record global temperatures, disrupted winter weather patterns across the Northern Hemisphere, and stress on agricultural systems worldwide — are still ahead.
If the 2026 El Niño reaches the strength that NOAA’s models unanimously project, it will be the defining climate event of the decade. And its effects will be felt in grocery stores, commodity markets, and weather forecasts far from the Pacific Ocean where it began.