If you have ever been confused by the fact that the same storm is called a hurricane in Miami, a typhoon in Manila, and a cyclone in Mumbai — or wondered why some years produce monster storms and others are eerily quiet — this guide explains everything. The science, the naming, the 2026 forecast, the deadliest storms in history, and what climate change is doing to the storms of the future.
- Hurricane, Typhoon, Cyclone — Same Storm, Different Name
- The Seven Cyclone Basins of the World
- 1. North Atlantic Basin
- 2. Northeast Pacific Basin
- 3. Northwest Pacific Basin (The Most Active on Earth)
- 4. North Indian Ocean Basin
- 5. Southwest Indian Ocean Basin
- 6. Australian Basin
- 7. South Pacific Basin
- How Tropical Cyclones Form: The Six Ingredients
- 1. Warm Ocean Water (at least 26.5°C / 80°F)
- 2. Distance From the Equator (at least 5° latitude)
- 3. Low Vertical Wind Shear
- 4. A Pre-Existing Disturbance
- 5. High Humidity in the Mid-Troposphere
- 6. Atmospheric Instability
- The Life Cycle: From Disturbance to Hurricane
- Stage 1: Tropical Disturbance
- Stage 2: Tropical Depression (up to 62 km/h / 38 mph)
- Stage 3: Tropical Storm (63–118 km/h / 39–73 mph)
- Stage 4: Hurricane / Typhoon / Cyclone (119+ km/h / 74+ mph)
- The Ending: Dissipation
- Inside a Hurricane: Eye, Eyewall, and Rain Bands
- The Saffir-Simpson Scale: Category 1 to 5
- How Hurricanes Get Their Names
- Why Storms Are Named At All
- The Six-Year Rotation
- When the List Runs Out
- Retiring a Name
- Tropical vs. Extratropical Cyclones: Two Completely Different Machines
- The 2026 Hurricane Season: Why El Niño Changed Everything
- How Cyclones Are Tracked and Forecast
- Satellites: The First Line of Detection
- Hurricane Hunters: Flying Into the Storm
- The 2026 Innovation: Uncrewed Aircraft
- Ocean Sensors and Underwater Gliders
- The Cone of Uncertainty
- The Deadliest Cyclones in History
- Storm Surge: The Real Killer
- How Storm Surge Forms
- What Makes Surge Worse
- Why Surge Kills
- Rapid Intensification: The Growing Danger
- Climate Change and the Future of Cyclones
- What to Do When a Cyclone Is Coming
- Before the Season (The Part Everyone Skips)
- When a Watch Is Issued (48 Hours Out)
- When a Warning Is Issued (36 Hours Out)
- During the Storm
- After the Storm
- Frequently Asked Questions
- What is the difference between a hurricane, typhoon, and cyclone?
- Why is the 2026 hurricane season below normal?
- What is the deadliest cyclone in history?
- What is rapid intensification?
- What is the difference between a tropical cyclone and an extratropical cyclone?
- How do hurricanes form?
- Can hurricanes cross the equator?
- What is a storm surge?
- How are hurricanes named?
- Which ocean basin has the most tropical cyclones?
- What is the difference between a hurricane watch and a hurricane warning?
- Why does the Bay of Bengal have so many deadly cyclones?
- Final Thoughts: Respect the Storm
Hurricane, Typhoon, Cyclone — Same Storm, Different Name
Let’s clear up the single most common point of confusion first: a hurricane, a typhoon, and a cyclone are the exact same type of storm. There is zero meteorological difference. The only thing that changes is the name, based on which ocean basin the storm forms in.
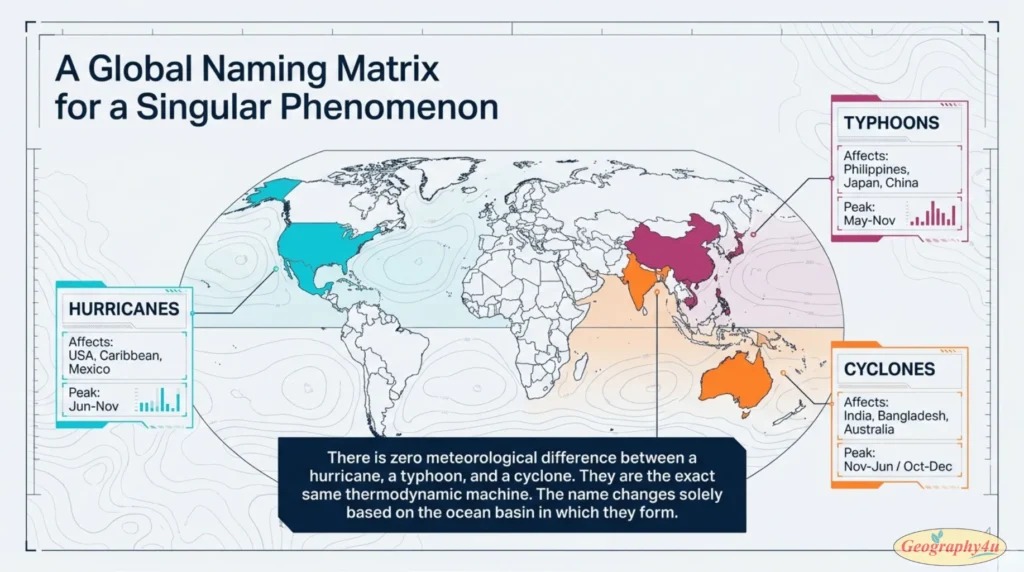
| Name Used | Ocean Basin | Countries Affected | Peak Season |
|---|---|---|---|
| Hurricane | North Atlantic, NE Pacific | USA, Caribbean, Mexico, Central America | Jun–Nov |
| Typhoon | Northwest Pacific | Philippines, Japan, China, Taiwan, Vietnam | May–Nov |
| Cyclone | South Pacific, Indian Ocean | India, Bangladesh, Myanmar, Australia, Madagascar | Apr–Jun, Oct–Dec (N Indian); Nov–Apr (S Indian/Australia) |
A storm that forms over the warm waters east of the Philippines and hits Japan is a typhoon. If an identical storm formed over the warm waters east of the Bahamas and hit Florida, it would be called a hurricane. And if it formed over the Bay of Bengal and hit Bangladesh, it would be a cyclone. Same physics, same structure, same destructive power — different name.
All three are types of tropical cyclone — the umbrella scientific term that covers every one of these storms regardless of location.
Hurricane = Typhoon = Cyclone. Same storm. The name depends on which ocean it forms in.
There are also regional names. Australians historically called cyclones “willy-willies.” In the Philippines, they are “baguios.” In Japan, “taifu.” None of these terms indicate a different type of storm — they’re all tropical cyclones viewed through different cultural lenses.
The Seven Cyclone Basins of the World
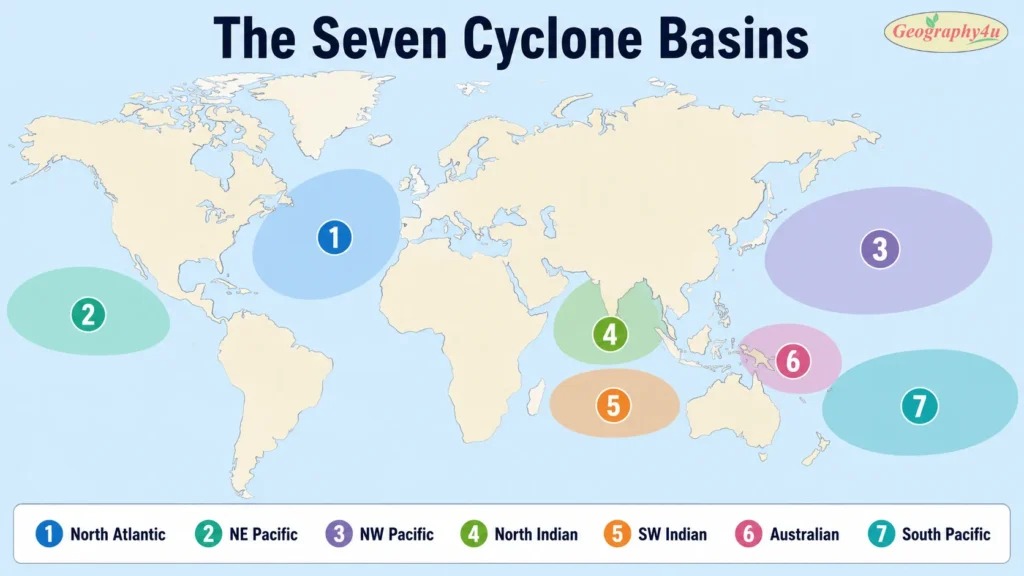
Tropical cyclones do not form randomly across the world’s oceans. They form in seven well-defined regions called basins, each with its own season, its own naming authority, and its own characteristic storm behavior. Understanding the basins explains a great deal about why some parts of the world experience far more destructive storms than others.
1. North Atlantic Basin
Covers the Atlantic Ocean, Caribbean Sea, and Gulf of Mexico. Season runs June 1 to November 30, with peak activity from mid-August through October. Averages 14 named storms per year. Most Atlantic hurricanes begin as African Easterly Waves and travel westward across the ocean. Despite producing fewer storms than the Pacific, the Atlantic gets disproportionate media attention because its storms threaten the United States.
2. Northeast Pacific Basin
Covers the Pacific Ocean east of 140°W. Season runs May 15 to November 30. Averages 15 named storms per year — slightly more active than the Atlantic. Most of these storms move harmlessly out to sea, though some strike Mexico’s Pacific coast or bring moisture to the American Southwest.
3. Northwest Pacific Basin (The Most Active on Earth)
Covers the Pacific west of 140°W, including the Philippines, Japan, Taiwan, China, and Vietnam. This is by far the most active tropical cyclone basin in the world, averaging 26 named storms per year — nearly double the Atlantic. It has no official season; typhoons can form in any month. The Northwest Pacific also produces the strongest storms on Earth, because it has the warmest water and the largest expanse of open ocean for storms to intensify over.
4. North Indian Ocean Basin
Covers the Bay of Bengal and the Arabian Sea. Averages only 5-6 named storms per year — the least active basin by storm count. But it is by far the deadliest. Seven of the ten deadliest tropical cyclones in recorded history occurred in the Bay of Bengal. The reason is geography: the Bay’s funnel shape amplifies storm surge, the surrounding land is extremely flat and low-lying, and it is one of the most densely populated coastal regions on Earth. This basin has a unique double season — pre-monsoon (April-June) and post-monsoon (October-December) — because the monsoon itself creates too much wind shear during July-September.
5. Southwest Indian Ocean Basin
Covers the Indian Ocean west of 90°E, affecting Madagascar, Mozambique, and the Mascarene Islands. Season runs November to April (Southern Hemisphere summer). Averages 9-10 named storms per year. Madagascar and Mozambique are among the most cyclone-vulnerable countries in Africa.
6. Australian Basin
Covers waters north of Australia from 90°E to 160°E. Season runs November to April. Averages 11 named storms per year. Northern Australia’s low population density means fewer casualties than comparable storms elsewhere, though cities like Darwin and Cairns face significant risk. Cyclone Tracy destroyed 70% of Darwin’s buildings on Christmas Day 1974.
7. South Pacific Basin
Covers the Pacific east of 160°E, affecting Fiji, Vanuatu, Samoa, Tonga, and New Caledonia. Season runs November to April. Averages 7-8 named storms per year. Small island nations in this basin are among the most vulnerable places on Earth to cyclones, because entire countries can be affected by a single storm.
The South Atlantic anomaly: There is one region of the tropical ocean where cyclones almost never form — the South Atlantic. Sea surface temperatures are too cool, wind shear is persistently high, and there is no equivalent of the African Easterly Waves to seed storm development. Only a handful of tropical cyclones have ever been recorded there, the most notable being Cyclone Catarina, which struck Brazil in March 2004.
How Tropical Cyclones Form: The Six Ingredients
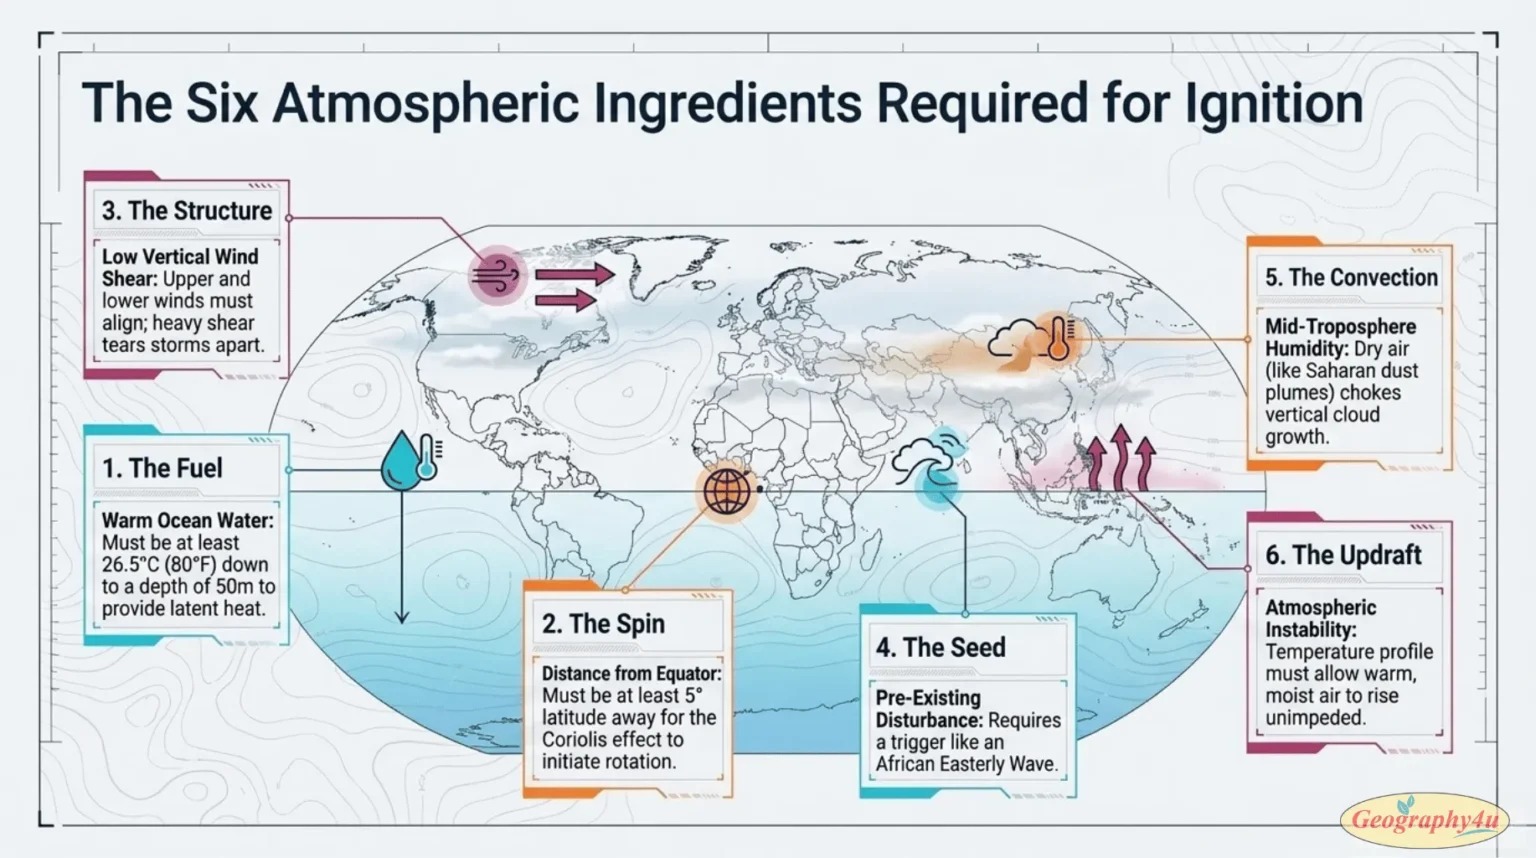
Tropical cyclones are the most powerful storms on Earth — a single mature hurricane releases energy equivalent to about 200 times the total worldwide electrical generating capacity, every single day. But they require very specific conditions to form. Remove any one ingredient and the storm fails.
1. Warm Ocean Water (at least 26.5°C / 80°F)
The ocean is the fuel tank. Tropical cyclones are powered by the evaporation of warm seawater — the warmer the water, the more evaporation, the more energy available. The critical threshold is 26.5°C (80°F) to a depth of at least 50 meters. This is why hurricanes form in the tropics during summer and autumn, when sea surface temperatures are at their highest.
2. Distance From the Equator (at least 5° latitude)
The Coriolis effect — the deflection of moving air caused by Earth’s rotation — is what gives cyclones their spin. At the equator, the Coriolis effect is zero. A storm needs to be at least 500 km (5° latitude) from the equator to develop the rotation required for cyclone formation. This is why tropical cyclones almost never form — and have never been observed to cross — the equator.
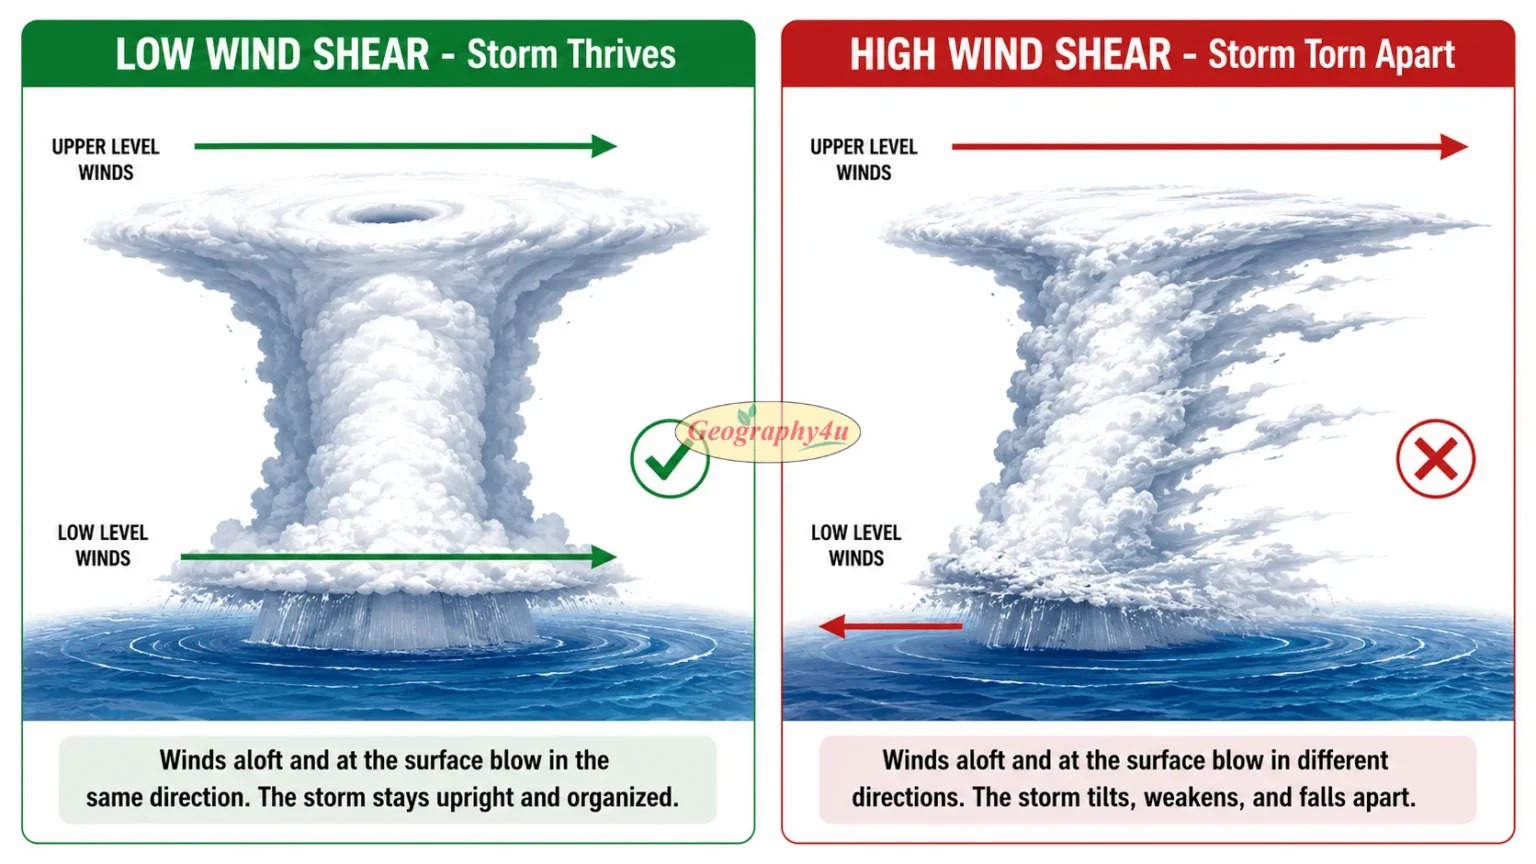
3. Low Vertical Wind Shear
Wind shear — the difference in wind speed or direction between the lower and upper atmosphere — is the single most common killer of developing tropical storms. If winds at 10,000 meters altitude are blowing at a very different speed or direction than winds at the surface, the storm’s structure gets literally torn apart before it can organize. This is the mechanism by which El Niño suppresses Atlantic hurricanes — it dramatically increases wind shear across the Atlantic basin.
4. A Pre-Existing Disturbance
Tropical cyclones do not spontaneously generate from calm ocean. They need a pre-existing atmospheric disturbance — a cluster of thunderstorms, a tropical wave, or some other area of organized convection — to serve as the “seed.” In the Atlantic, most hurricane seeds are African Easterly Waves — ripples in the atmosphere that travel westward off the coast of West Africa.
5. High Humidity in the Mid-Troposphere
Dry air in the mid-levels of the atmosphere suppresses the convection (rising motion) that a developing storm needs. Saharan dust outbreaks — massive plumes of dry, dusty air from the Sahara Desert — are one of the main reasons many Atlantic tropical waves die before becoming hurricanes.
6. Atmospheric Instability
The atmosphere needs to be unstable enough for warm, moist air to keep rising through the entire depth of the troposphere. If a stable layer (temperature inversion) exists at mid-levels, it acts as a lid that prevents the deep convection needed to fuel a tropical cyclone.
Deep dive: The Complete Science of Tropical Cyclone Formation →
The Life Cycle: From Disturbance to Hurricane
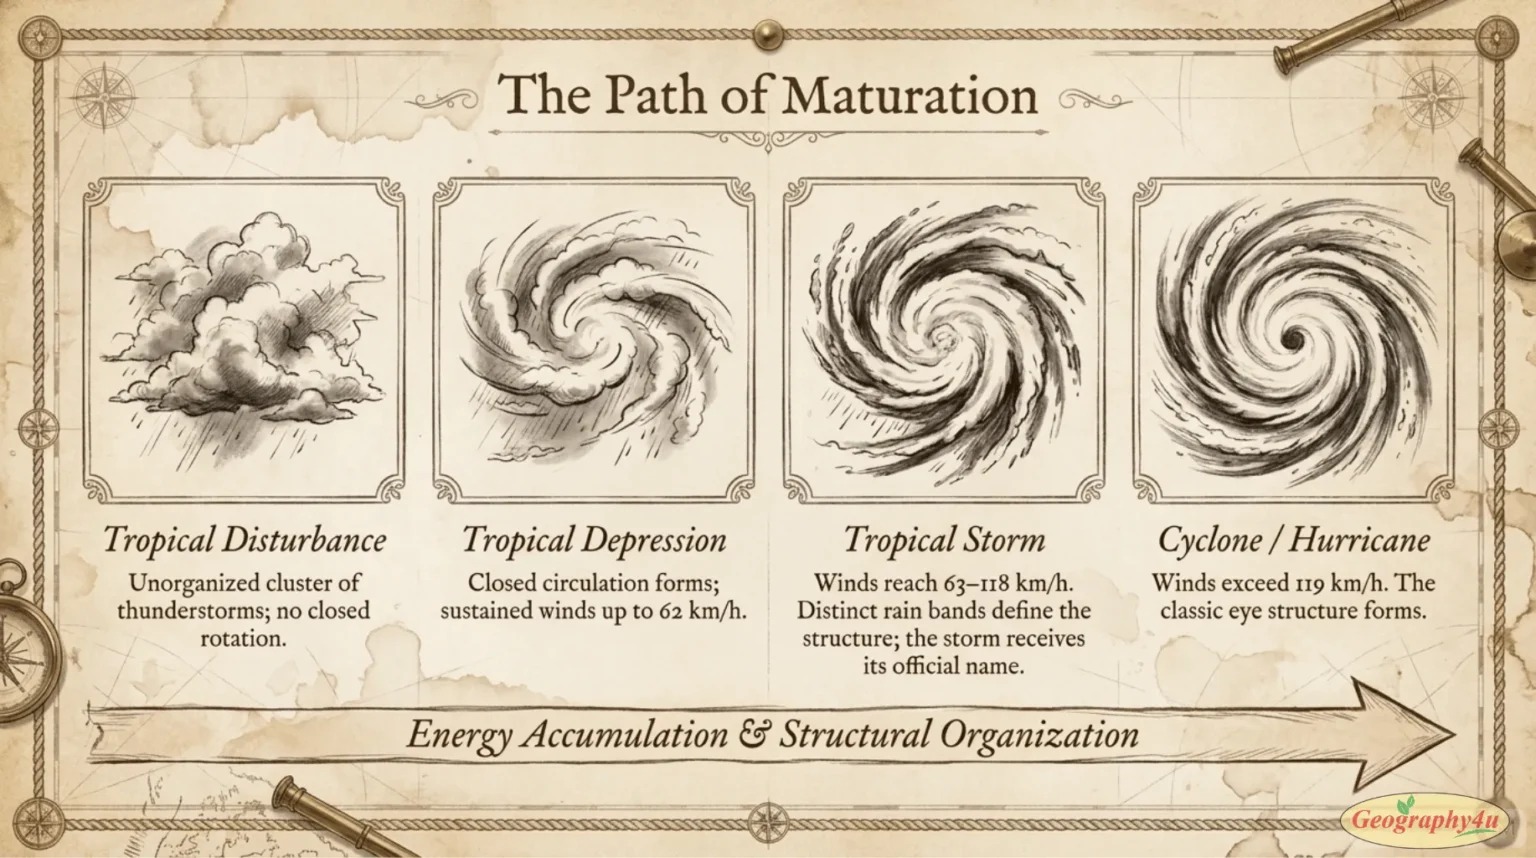
A hurricane does not appear fully formed. It passes through four distinct stages, each with its own classification and its own wind speed threshold. Understanding these stages helps explain why forecasters watch some disturbances closely for days while ignoring others entirely.
Stage 1: Tropical Disturbance
An unorganized cluster of thunderstorms over warm tropical water, with little or no rotation. Hundreds of these form every hurricane season. Most dissipate within a day or two. Only a small fraction — roughly 10% in the Atlantic — go on to become named storms. Forecasters at the National Hurricane Center monitor dozens of disturbances at any given time during peak season.
Stage 2: Tropical Depression (up to 62 km/h / 38 mph)
The disturbance develops a closed circulation — a defined center around which winds rotate. At this point it receives a number (e.g., “Tropical Depression Seven”). Rainfall becomes organized into bands. The system now has a recognizable structure on satellite imagery, though it lacks the intensity to cause major damage.
Stage 3: Tropical Storm (63–118 km/h / 39–73 mph)
Once sustained winds reach 63 km/h, the system is upgraded to a tropical storm and receives a name. Rain bands become better defined, and the storm begins to take on the spiral appearance visible from space. Tropical storms can already cause significant flooding — Tropical Storm Allison (2001) caused $9 billion in damage in Houston without ever becoming a hurricane.
Stage 4: Hurricane / Typhoon / Cyclone (119+ km/h / 74+ mph)
At 119 km/h sustained winds, the storm officially becomes a hurricane (or typhoon or cyclone, depending on basin). An eye typically forms at this stage, surrounded by the eyewall. The storm now has the classic structure — and the classic destructive power — associated with these systems.
The Ending: Dissipation
Tropical cyclones die in one of three ways. Landfall cuts off the warm-water fuel supply, causing rapid weakening — most hurricanes lose half their intensity within 24 hours of moving inland. Moving over cold water has the same effect, which is why hurricanes weaken as they travel north into the North Atlantic. Encountering strong wind shear tears the storm’s vertical structure apart. Some storms also undergo extratropical transition, transforming into a completely different type of storm rather than dissipating.
Inside a Hurricane: Eye, Eyewall, and Rain Bands
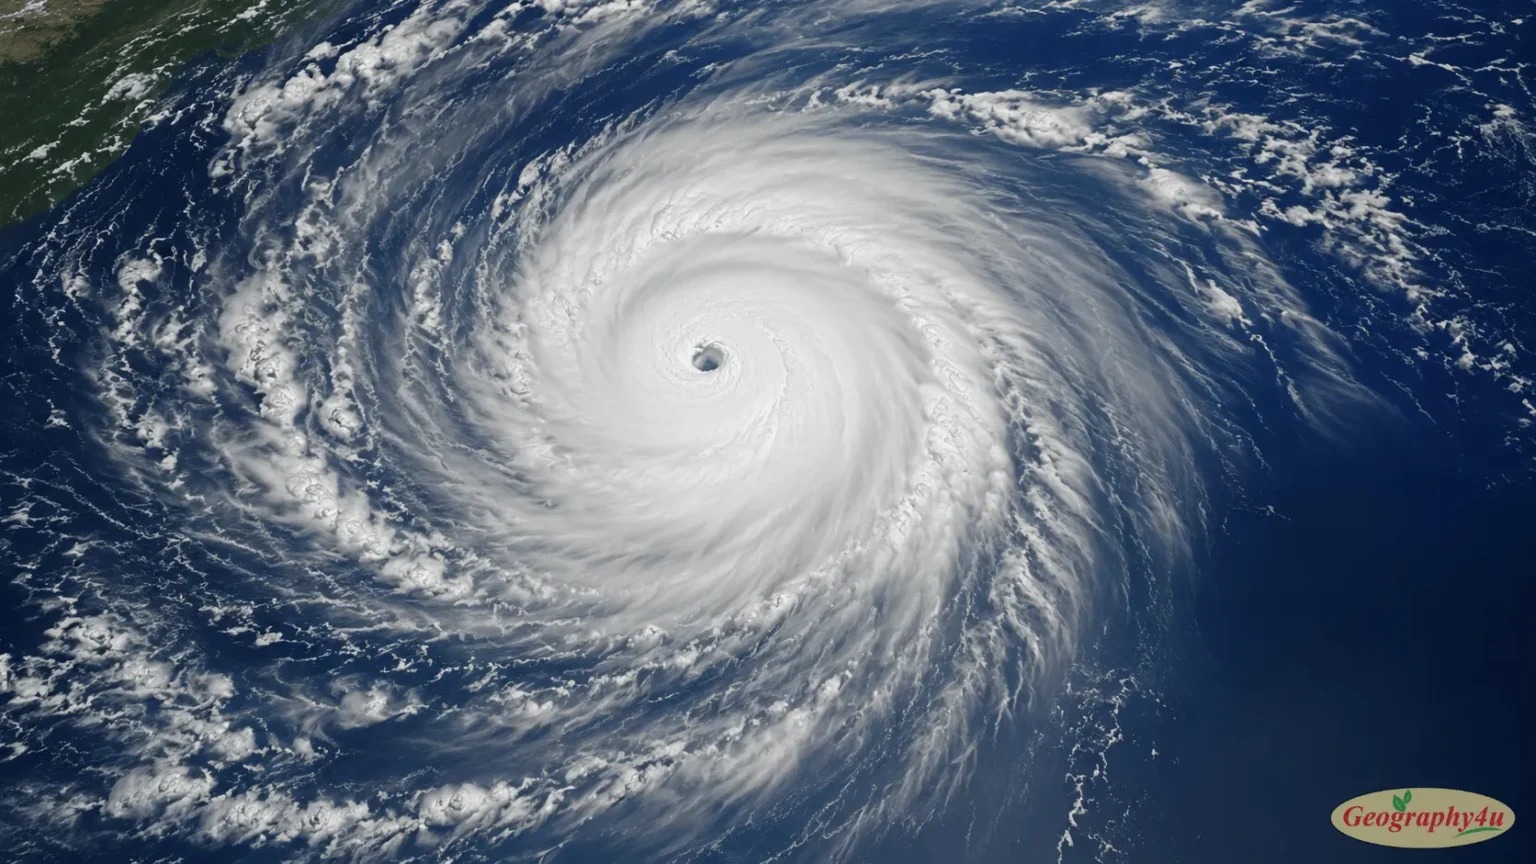
A mature tropical cyclone is one of the most organized structures in the atmosphere. From space, it looks like a giant spiral galaxy of cloud. In cross-section, it reveals a precise architecture.
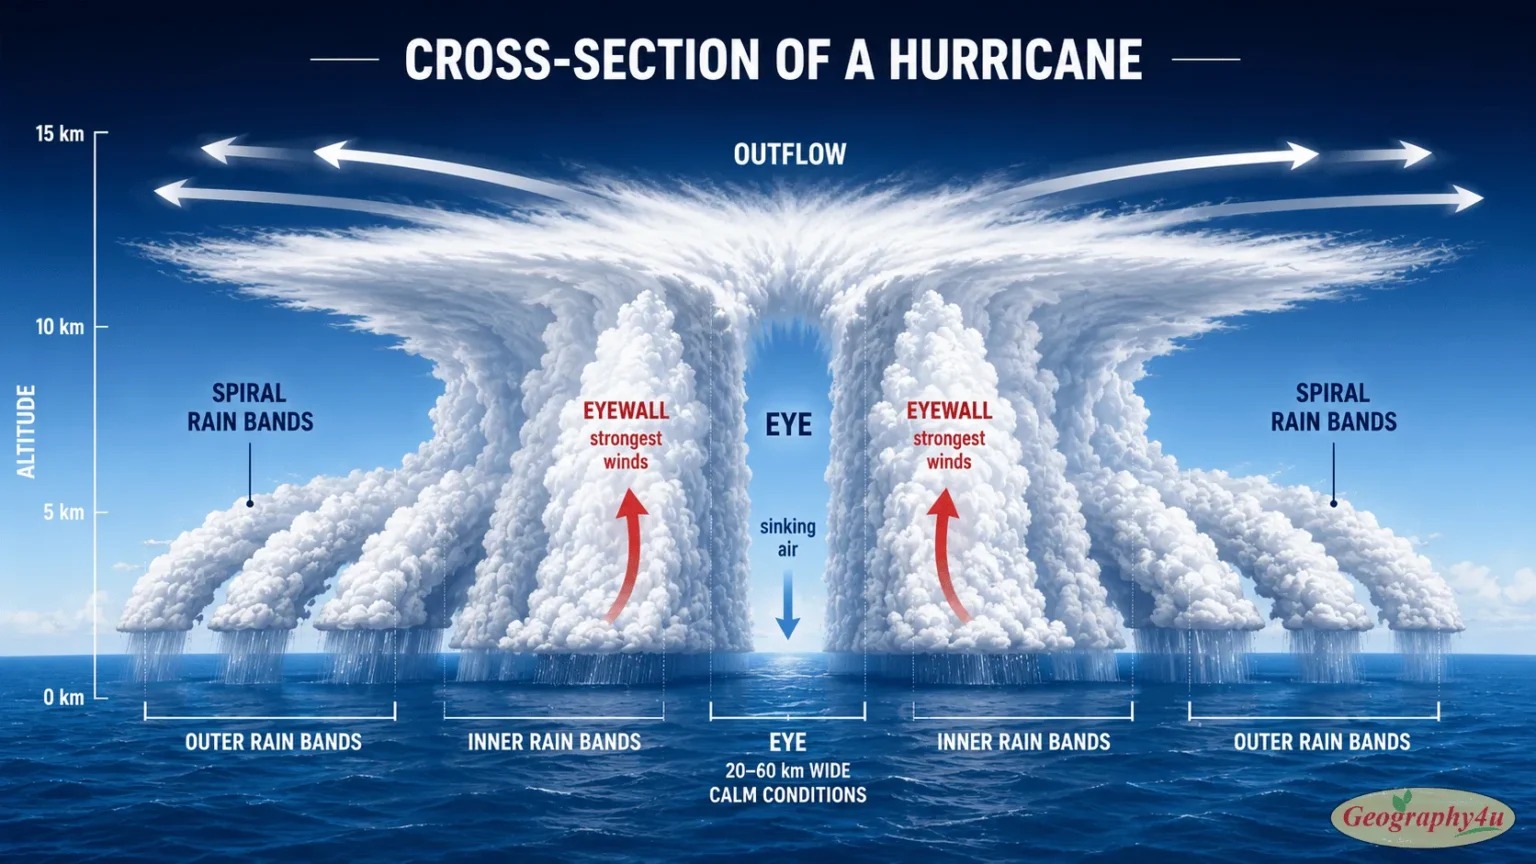
The Eye — a calm, often cloudless circle at the center, typically 20-40 km in diameter. Inside the eye, winds are light, skies can be clear, and the pressure is at its lowest. Temperatures in the eye are warmer than the surrounding storm due to sinking air. Residents caught in the eye sometimes mistake the calm for the storm’s end — only to be hit by the eyewall when the other side arrives.
The Eyewall — a ring of the most intense thunderstorms surrounding the eye, typically 10-20 km wide. This is where the strongest winds and heaviest rainfall occur. The most violent updrafts in the eyewall can reach speeds of 20-30 meters per second (45-67 mph) — straight up.
Spiral Rain Bands — curved bands of thunderstorms extending outward from the eyewall, sometimes reaching hundreds of kilometers from the center. These bands produce heavy rain, gusty winds, and occasional tornadoes. They give the storm its characteristic spiral appearance from satellite imagery.
The Outflow — at the top of the storm (10-15 km altitude), air that has risen through the eyewall spreads outward in all directions. This upper-level outflow is visible from space as a smooth, circular canopy of cirrus cloud that caps the storm. Efficient outflow is critical — if the air cannot escape at the top, the storm chokes itself.
The Saffir-Simpson Scale: Category 1 to 5
The Saffir-Simpson Hurricane Wind Scale classifies hurricanes by their maximum sustained wind speed. It applies only to hurricanes in the Atlantic and Northeast Pacific — typhoons use a different scale, and cyclones in the Indian Ocean have their own classification. But the Saffir-Simpson is the most widely known globally.
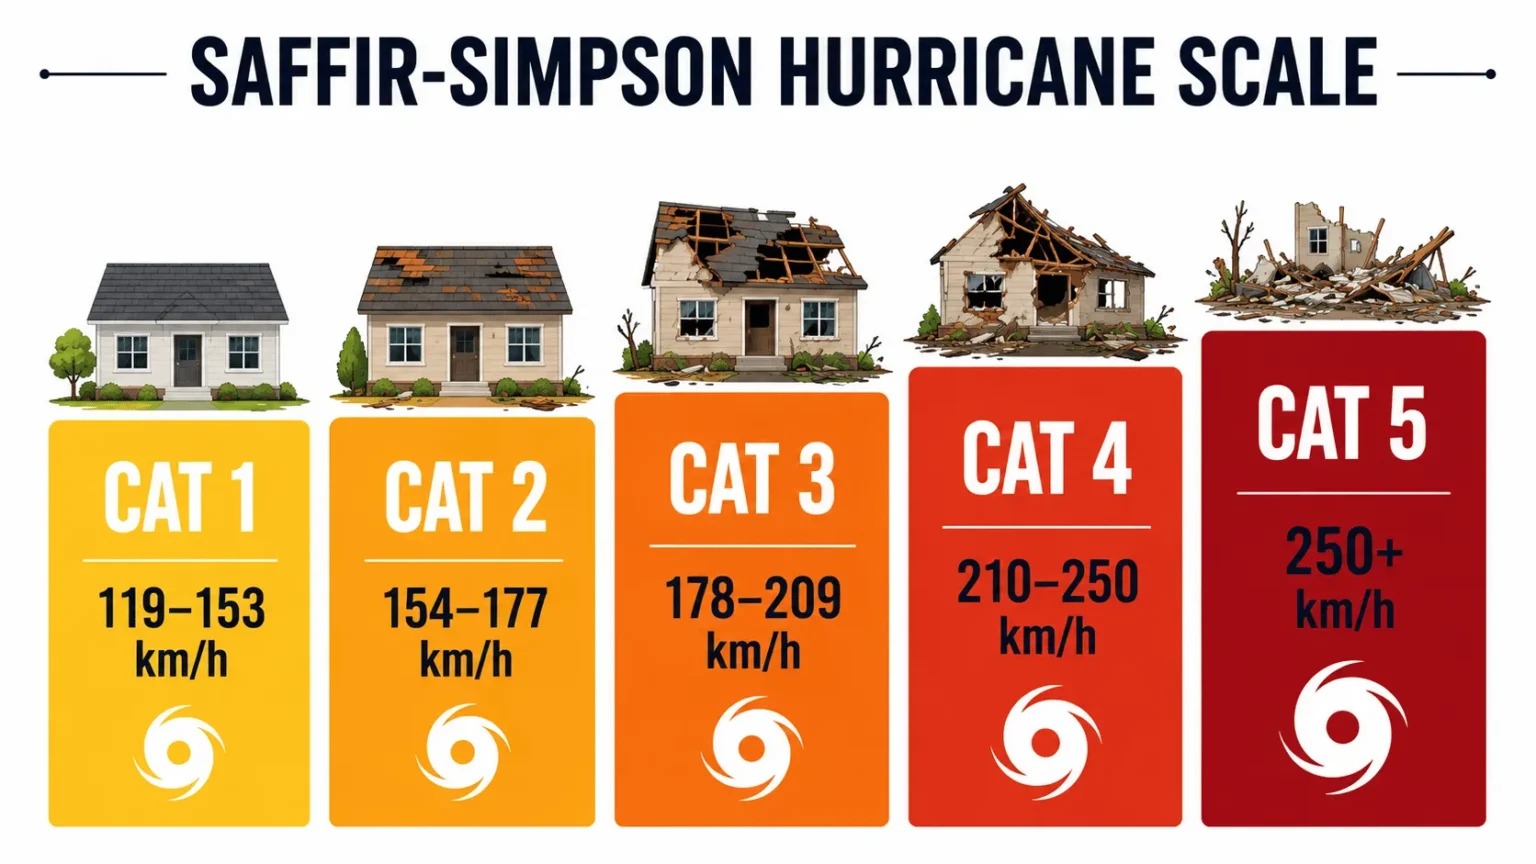
| Category | Wind Speed | Damage | Notable Example |
|---|---|---|---|
| 1 | 119–153 km/h (74–95 mph) | Minimal — roof damage, fallen trees | Hurricane Dolly (2008) |
| 2 | 154–177 km/h (96–110 mph) | Moderate — major roof damage, power outages lasting days-weeks | Hurricane Zeta (2020) |
| 3 (Major) | 178–209 km/h (111–130 mph) | Extensive — structural damage, inland flooding | Hurricane Katrina (2005, at landfall) |
| 4 | 210–250 km/h (131–155 mph) | Extreme — catastrophic damage, areas uninhabitable for weeks-months | Hurricane Ian (2022) |
| 5 | >250 km/h (>155 mph) | Catastrophic — total destruction of structures, areas uninhabitable for months | Hurricane Allen (1980), Super Typhoon Haiyan (2013) |
A critical note: the Saffir-Simpson scale measures only wind speed. It does not account for storm surge (the wall of seawater pushed ashore), rainfall flooding, or storm size — all of which can make a “lower category” storm far more deadly than a higher one. Hurricane Harvey (2017) made landfall as a Category 4 but caused most of its $125 billion in damage through rainfall flooding, not wind. Hurricane Katrina killed most of its 1,800+ victims through storm surge, not wind.
How Hurricanes Get Their Names
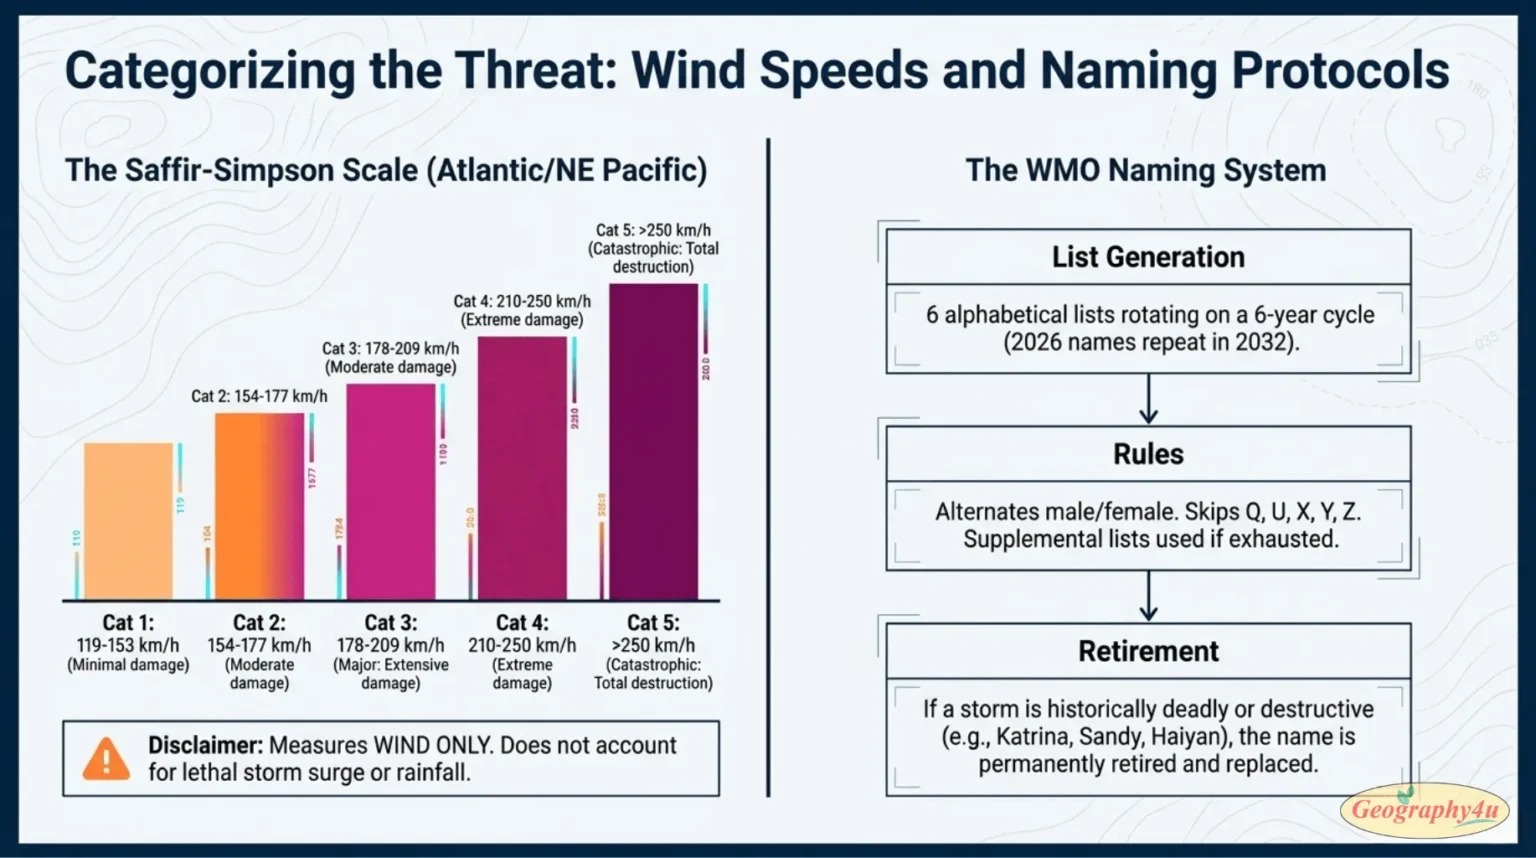
Every year, people ask the same question: who decides that a storm will be called Katrina, or Sandy, or Haiyan? The answer involves six rotating lists, an international committee, and a surprisingly formal process for retiring names.
Why Storms Are Named At All
Before the naming system, storms were identified by latitude and longitude coordinates — a system that was confusing, error-prone, and useless for public communication. During World War II, US Navy meteorologists began informally naming Pacific storms after their wives and girlfriends. The practice was formalized in 1953, when the US National Hurricane Center began using an official alphabetical list of female names. Male names were added in 1979 after sustained criticism of the gender bias.
The purpose is entirely practical. It is far easier for the public, emergency managers, and the media to track “Hurricane Maria” than “the tropical cyclone currently centered at 18.2°N, 65.8°W.” When multiple storms are active simultaneously — which happens regularly during peak season — distinct names prevent potentially fatal confusion.
The Six-Year Rotation
The World Meteorological Organization maintains six alphabetical lists of names for the Atlantic basin, which rotate on a six-year cycle. The list used in 2026 will be used again in 2032. Each list contains 21 names — the letters Q, U, X, Y, and Z are skipped because too few suitable names begin with them. Names alternate between male and female, and reflect the languages of the affected region: English, Spanish, and French for the Atlantic.
Other basins have their own systems. The Northwest Pacific uses a rotating list of 140 names contributed by 14 countries — including names of animals, flowers, and mythological figures rather than personal names. The North Indian Ocean basin uses names contributed by 13 member countries including India, Bangladesh, Pakistan, and Myanmar.
When the List Runs Out
In exceptionally active seasons, the 21-name list can be exhausted. This happened in 2005 (28 named storms) and 2020 (30 named storms). Historically, forecasters then switched to the Greek alphabet — Alpha, Beta, Gamma. But after the 2020 season, the WMO abandoned this practice, concluding that Greek letters caused confusion and distracted from the storms themselves. A supplemental list of names is now used instead.
Retiring a Name
When a storm is so deadly or destructive that reusing its name would be insensitive or confusing, the WMO retires it permanently. Retired Atlantic names include Katrina, Sandy, Maria, Harvey, Irma, Ian, Andrew, Camille, and Mitch. More than 90 Atlantic names have been retired since 1954. A retired name is replaced with a new name beginning with the same letter — Katrina was replaced by Katia, Sandy by Sara.
Being retired is, in a grim sense, a mark of historical significance. It means the storm was catastrophic enough that its name will forever be associated with a single event.
Tropical vs. Extratropical Cyclones: Two Completely Different Machines
The word “cyclone” technically applies to any large-scale rotating wind system around a low-pressure center. But the two main types — tropical cyclones and extratropical (temperate) cyclones — are fundamentally different weather systems driven by completely different energy sources.
| Feature | Tropical Cyclone | Extratropical (Temperate) Cyclone |
|---|---|---|
| Energy source | Latent heat from warm ocean water | Temperature contrast between air masses |
| Core temperature | Warm core | Cold core |
| Where they form | Tropics (5°–20° latitude), over warm ocean | Mid-latitudes (35°–65°), along frontal boundaries |
| Size | Compact: 200–600 km diameter | Massive: 1,000–3,000+ km diameter |
| Maximum winds | Can exceed 300 km/h | Rarely exceed 120 km/h |
| Has an eye? | Yes — clearly defined | No |
| Has fronts? | No (symmetric) | Yes — warm front, cold front, occluded front |
| Lifespan | Days to 2 weeks | Days to 1 week (individual); family can last weeks |
| Season | Summer and autumn | Year-round, but strongest in winter |
| Movement | East to west (steered by trade winds) | West to east (steered by westerlies) |
Tropical cyclones are heat engines — they extract energy from warm ocean water. When they move over land or cold water, they lose their fuel and die. Extratropical cyclones are frontal systems — they form where cold polar air meets warm tropical air, and they can operate perfectly well over land. The nor’easters that hammer the US East Coast and the winter storms that batter Europe are all extratropical cyclones.
Sometimes, a tropical cyclone that moves into higher latitudes transforms into an extratropical cyclone — a process called extratropical transition. Hurricane Sandy (2012) became an extratropical storm just before hitting New Jersey, but its massive size meant it still caused $70 billion in damage.
Deep dive: How Extratropical Cyclones Form: Polar Front Theory and the Life Cycle →
The 2026 Hurricane Season: Why El Niño Changed Everything
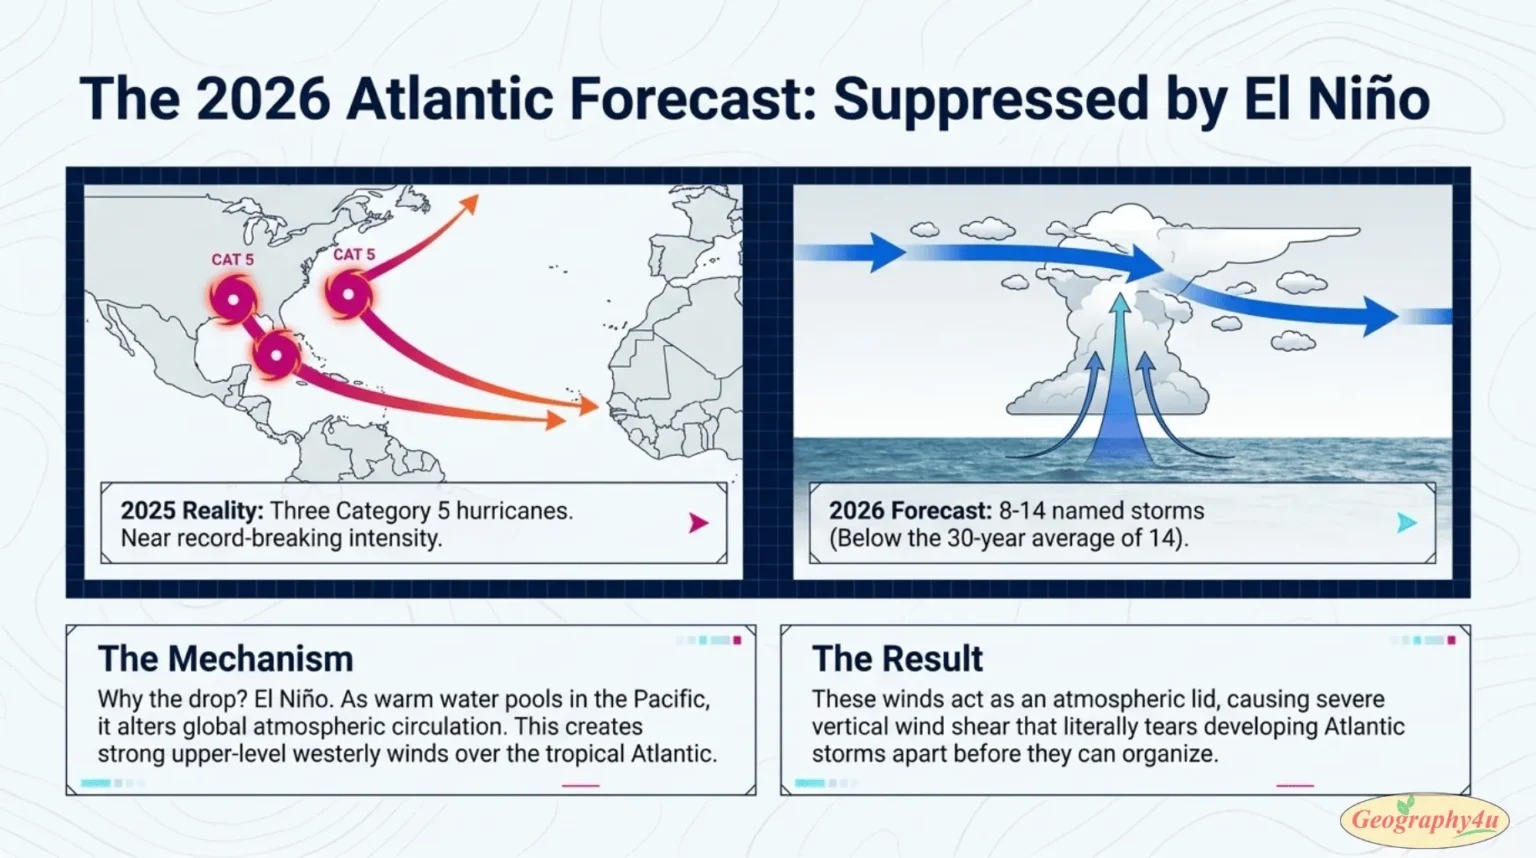
The 2025 and 2026 Atlantic hurricane seasons could not be more different. In 2025, the Atlantic produced three Category 5 hurricanes — just one shy of the all-time record of four. In 2026, NOAA is forecasting one of the quietest seasons in years.
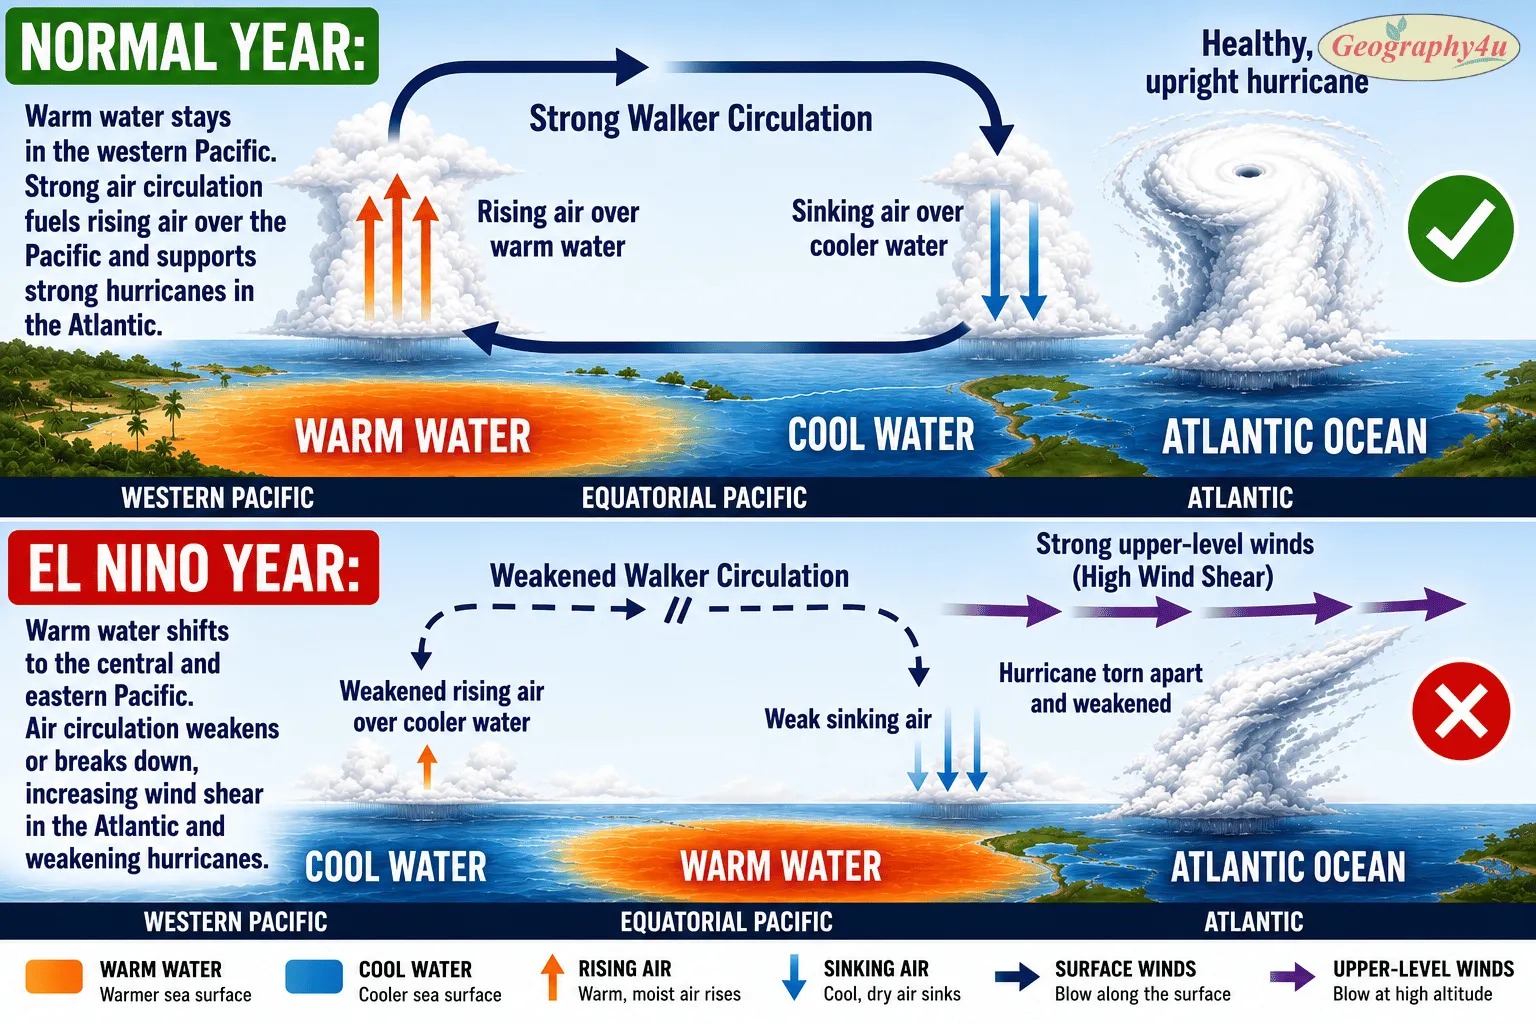
The reason is a single word: El Niño.
NOAA’s May 2026 outlook predicts a 55% chance of a below-normal season, with 8-14 named storms, 3-6 hurricanes, and 1-3 major hurricanes — compared to the 30-year average of 14 named storms and 7 hurricanes. Colorado State University, another leading forecaster, has also revised its forecast downward.
El Niño suppresses Atlantic hurricanes through a specific mechanism: it increases vertical wind shear across the Atlantic basin. As warm water pools in the central and eastern Pacific, it alters upper-level atmospheric circulation patterns, creating stronger upper-level westerly winds over the tropical Atlantic. These winds literally tear apart developing storms before they can organize.
The 2026 season has already seen its first named storm — Tropical Storm Arthur, which impacted the Texas coast in mid-June. But the peak of hurricane season (mid-August through October) is still ahead, and El Niño’s suppressive effect is expected to strengthen through the autumn.
The irony is hard to miss: the same El Niño that is suppressing Atlantic hurricanes is simultaneously weakening the Indian monsoon — the subject of our companion article on Geography4u.
Related read: How El Niño Is Weakening the 2026 Indian Monsoon →
How Cyclones Are Tracked and Forecast
Fifty years ago, a hurricane could strike a coastline with less than 24 hours of warning. Today, forecasters can predict a storm’s track five days in advance with reasonable accuracy. That improvement has saved tens of thousands of lives — and it comes from a combination of satellites, aircraft, ocean sensors, and enormous computing power.
Satellites: The First Line of Detection
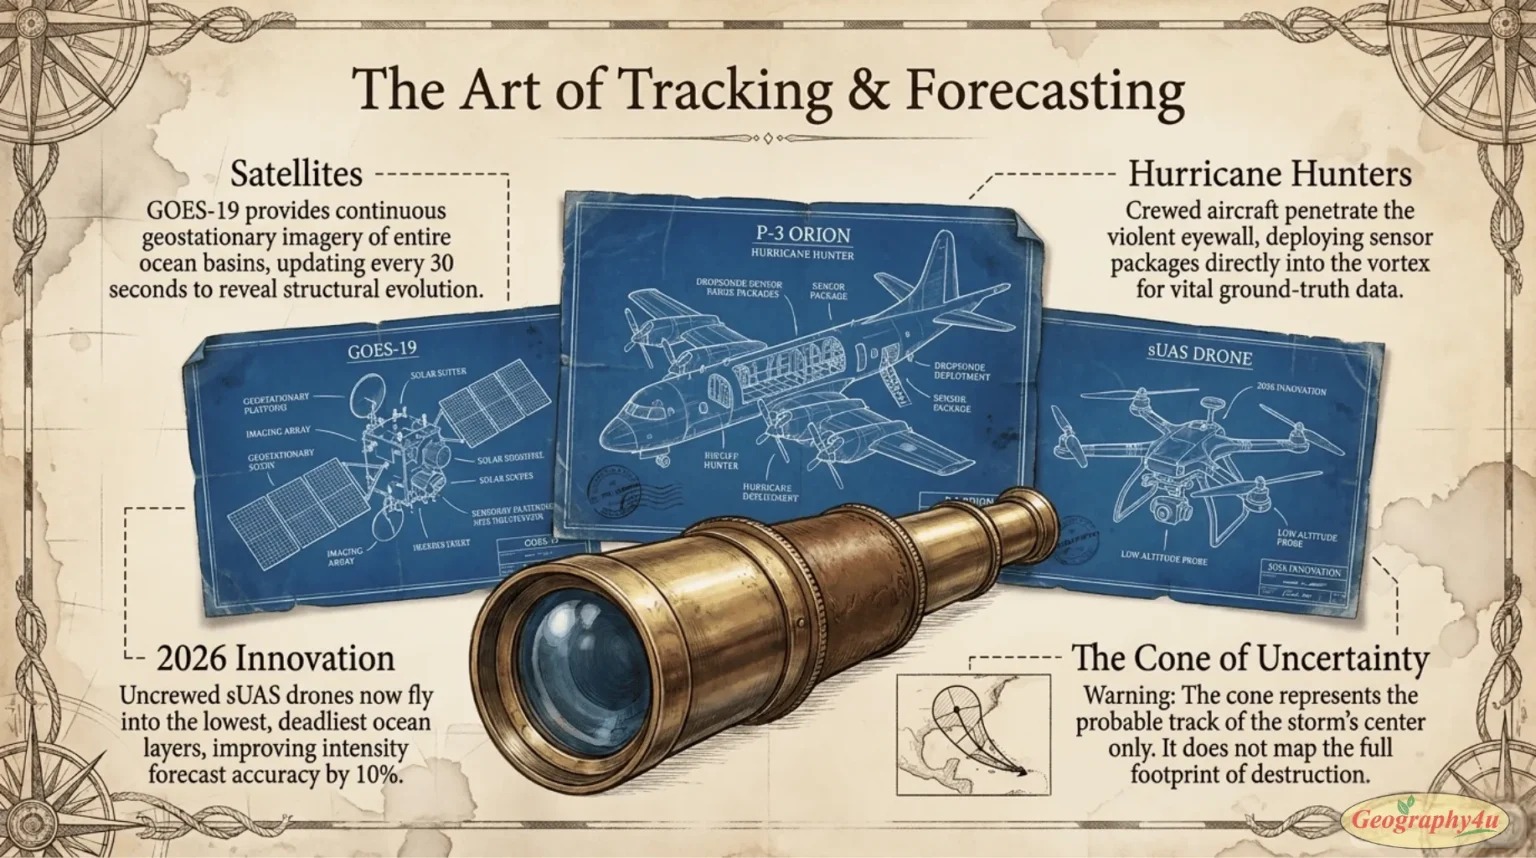
Geostationary weather satellites — parked 36,000 km above the equator — provide continuous imagery of entire ocean basins. Modern satellites like GOES-19 (covering the Atlantic) update every 30 seconds during severe weather, allowing forecasters to watch a storm’s structure evolve almost in real time. Satellite imagery reveals cloud patterns, eye formation, and the overall organization of a storm — the primary indicators used to estimate intensity from space.
Hurricane Hunters: Flying Into the Storm
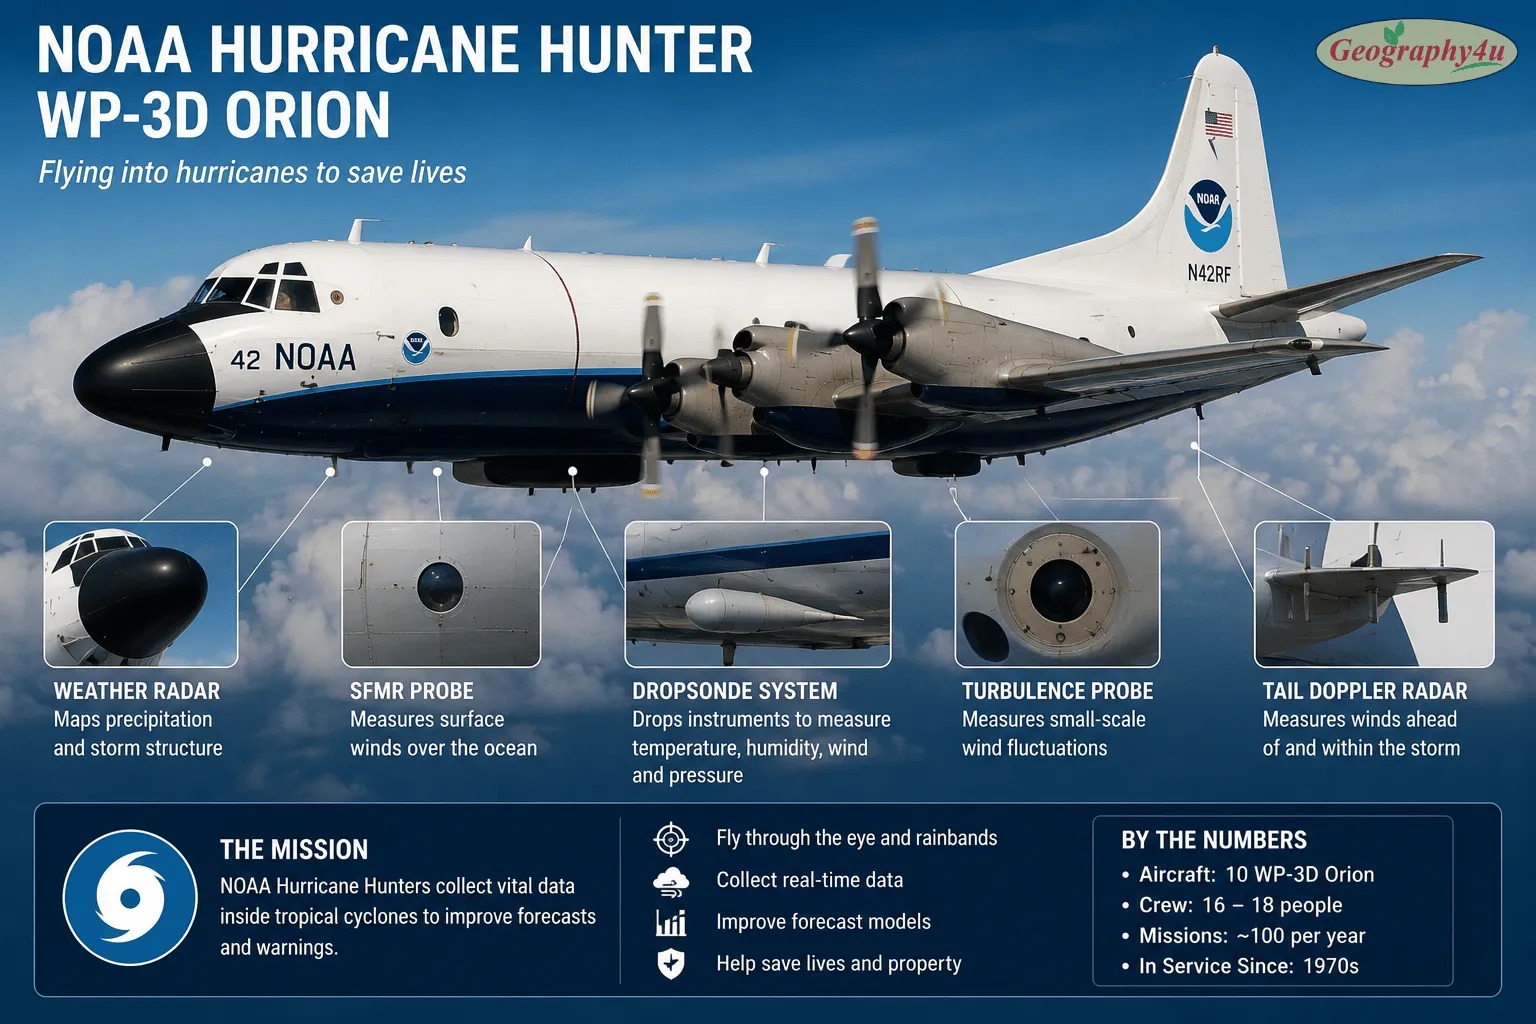
Satellite estimates are good, but they are estimates. To get actual measurements, NOAA and the US Air Force fly aircraft directly into hurricanes. The Hurricane Hunters — flying WP-3D Orion turboprops and Gulfstream IV jets — penetrate the eyewall, drop instrument packages called dropsondes through the storm, and measure wind speed, pressure, temperature, and humidity directly.
These flights are the only way to obtain the ground-truth measurements that determine a storm’s official category. A hurricane’s stated intensity is almost always based on aircraft data when it is within range of the aircraft.
The 2026 Innovation: Uncrewed Aircraft
For the first time in the 2026 hurricane season, NOAA is integrating data from small uncrewed aircraft systems (sUAS) into its Hurricane Analysis and Forecast System. These drones can fly at altitudes too dangerous for crewed aircraft — including the lowest layers of the storm, just above the ocean surface, where the exchange of heat and moisture between sea and atmosphere actually happens.
Research from NOAA’s Atlantic Oceanographic and Meteorological Laboratory found that incorporating sUAS data improves hurricane intensity forecast accuracy by approximately 10%. Intensity forecasting has lagged far behind track forecasting for decades — this is a meaningful step toward closing that gap.
Ocean Sensors and Underwater Gliders
Because ocean heat content drives storm intensity, forecasters need to know not just the surface temperature but how deep the warm layer extends. Autonomous underwater gliders and drifting buoys measure ocean temperature profiles ahead of approaching storms, feeding data directly into forecast models. This is how forecasters identify the deep warm pools that fuel rapid intensification.
The Cone of Uncertainty
The familiar “cone” graphic issued by the National Hurricane Center is widely misunderstood. The cone shows the probable track of the storm’s center — it is not the area that will experience impacts. Historically, the storm’s center stays within the cone about two-thirds of the time. Dangerous conditions routinely extend far outside the cone, especially on the storm’s right side in the Northern Hemisphere. For the 2026 season, the NHC’s cone graphic has been updated to also depict inland tropical storm and hurricane watches and warnings — an attempt to address exactly this misinterpretation.
The Deadliest Cyclones in History
The destructive power of tropical cyclones is not theoretical. Over the past century alone, they have killed millions of people — with the Bay of Bengal region accounting for a disproportionate share of the death toll.
Storm
Year
Region
Deaths
Key Factor
Bhola Cyclone
1970
Bangladesh (East Pakistan)
300,000–500,000
35-ft storm surge over flat delta at night
Hooghly River Cyclone
1737
India / Bangladesh
~350,000
Storm surge up the Hooghly River
Haiphong Typhoon
1881
Vietnam
~300,000
Coastal flooding
Cyclone Nargis
2008
Myanmar
138,366
Government delayed warnings and aid
Cyclone Gorky
1991
Bangladesh
138,866
20-ft storm surge, 155 mph winds
Super Typhoon Nina
1975
China
~200,000
Dam failures from extreme rainfall
Super Typhoon Haiyan
2013
Philippines
6,300+
195 mph at landfall — one of strongest ever measured
Hurricane Katrina
2005
USA (Louisiana)
1,833
28-ft storm surge, levee failures in New Orleans
A pattern emerges from this table: storm surge kills more people than wind. In fact, roughly 90% of all tropical cyclone fatalities in history are from storm surge — the massive wall of seawater pushed ashore by the cyclone’s winds. Low-lying delta regions like Bangladesh’s Ganges Delta are extraordinarily vulnerable because even a modest surge can travel kilometers inland.
The good news: death tolls from cyclones have dropped dramatically since the mid-20th century. Bangladesh’s cyclone shelter program — which has built thousands of concrete shelters across the coastal belt — has reduced death tolls from comparable storms by 95% compared to the Bhola era. No cyclone has killed more than 10,000 people globally since Cyclone Nargis in 2008, largely thanks to improved warning systems and evacuation infrastructure.
Storm Surge: The Real Killer
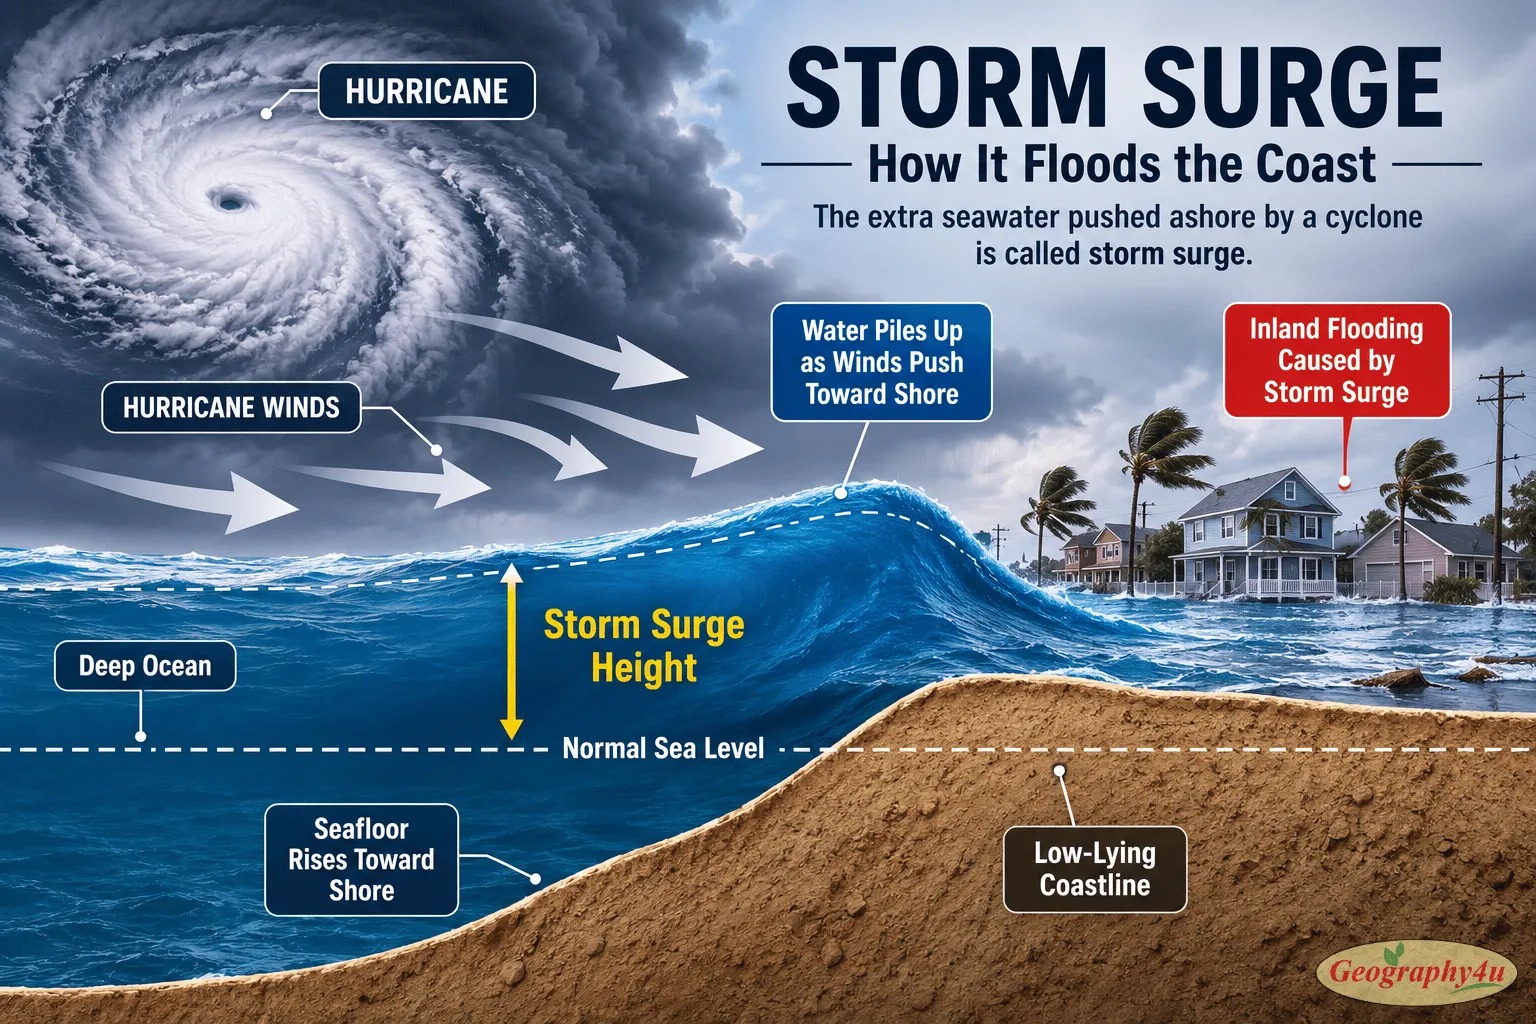
Ask most people what makes a hurricane dangerous and they will say wind. They are wrong. Storm surge — the abnormal rise of seawater pushed ashore by a cyclone’s winds — is responsible for roughly 90% of all tropical cyclone deaths in recorded history. Understanding why is essential to understanding cyclone risk.
How Storm Surge Forms
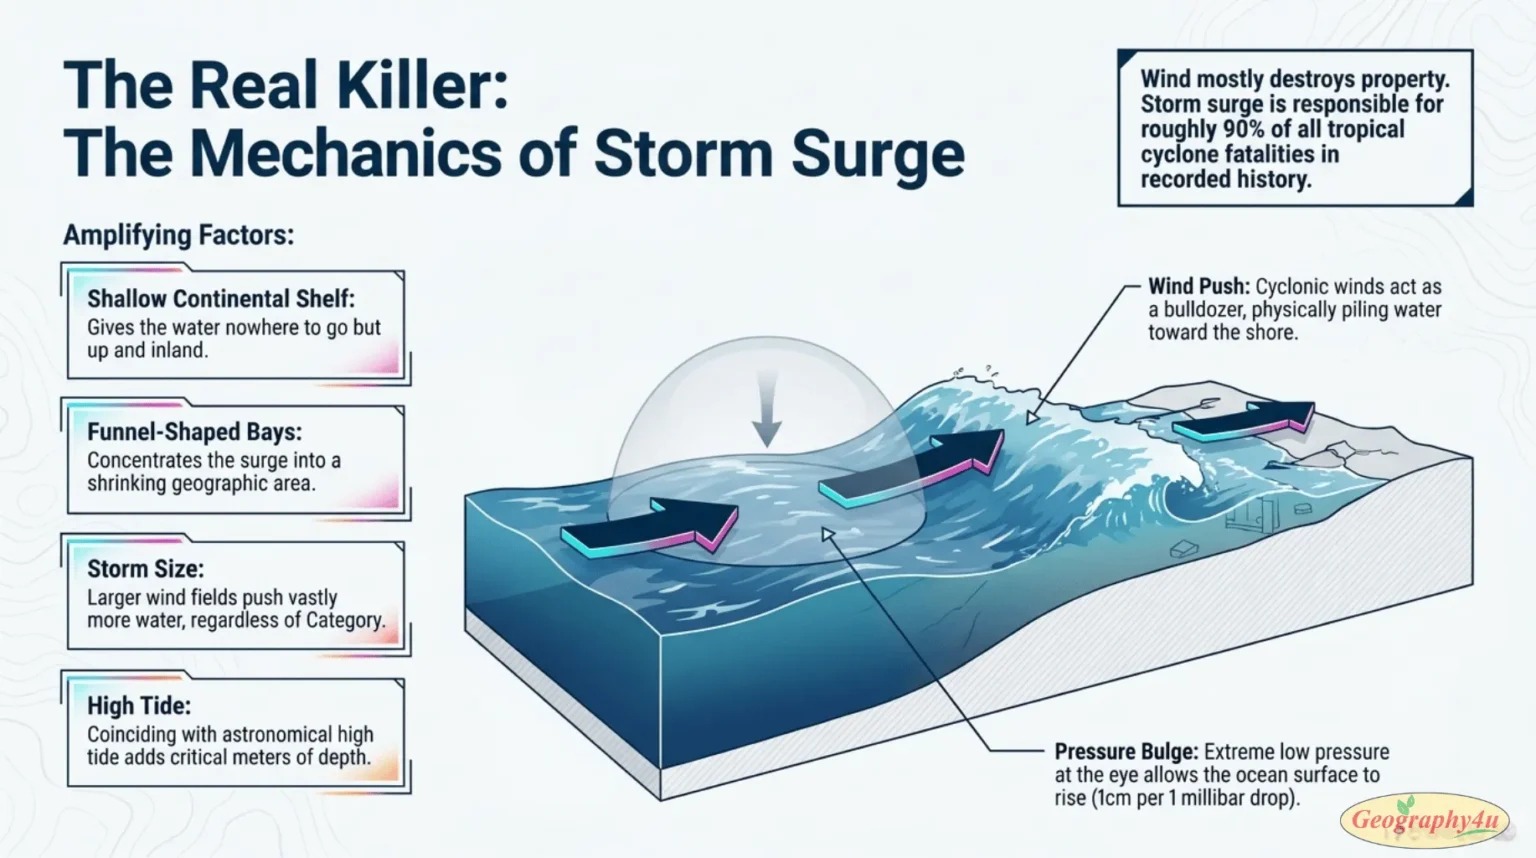
Two forces combine to produce storm surge. First, the cyclone’s winds physically push water toward the shore, piling it up against the coastline — this accounts for most of the surge. Second, the extremely low atmospheric pressure at the storm’s center allows the ocean surface to bulge upward slightly, adding roughly 1 cm of height for every 1 millibar of pressure drop.
When this mass of water reaches shallow coastal water, it has nowhere to go but up and inland. A surge that is barely noticeable in deep ocean can become a 6-meter wall of water at the coast.
What Makes Surge Worse
- Shallow continental shelf. A gently sloping seafloor allows surge to build much higher than a steep drop-off. This is why the Gulf of Mexico and the Bay of Bengal produce catastrophic surges while deep-water coastlines like Hawaii’s do not.
- Funnel-shaped bays. Coastlines that narrow inland — like the Bay of Bengal, Apalachee Bay in Florida, or the head of the Gulf of Mexico — concentrate surge water into an ever-smaller area, dramatically amplifying its height.
- Storm size. A large storm pushes far more water than a small one, even at the same wind speed. Hurricane Sandy was only a Category 1 at landfall but produced a devastating surge because it was one of the largest Atlantic storms ever measured.
- Angle of approach. A storm moving perpendicular to the coast pushes water directly onshore. A storm moving parallel to the coast produces far less surge.
- Tide timing. Surge riding on top of high tide can add several additional meters. The Bhola Cyclone’s catastrophic death toll was partly because its 35-foot surge coincided with high tide, at night, when people were asleep.
Why Surge Kills
Moving water is extraordinarily powerful. Just 15 cm of moving water can knock an adult off their feet. Sixty centimeters can float a car. Storm surge arrives fast — often rising several meters within an hour — trapping people who waited too long to evacuate. And it carries debris: cars, building materials, boats, and trees moving at speed through what was recently a residential street.
This is why evacuation orders for coastal zones are non-negotiable. Structures can be rebuilt. Nobody survives being caught in a 5-meter surge.
Rapid Intensification: The Growing Danger
In recent years, a new term has entered the public vocabulary around hurricanes: rapid intensification. Defined as an increase in maximum sustained winds of at least 35 mph (30 knots) within 24 hours, rapid intensification is the phenomenon that turns a manageable tropical storm into a Category 4 or 5 monster overnight — giving coastal communities almost no time to prepare.
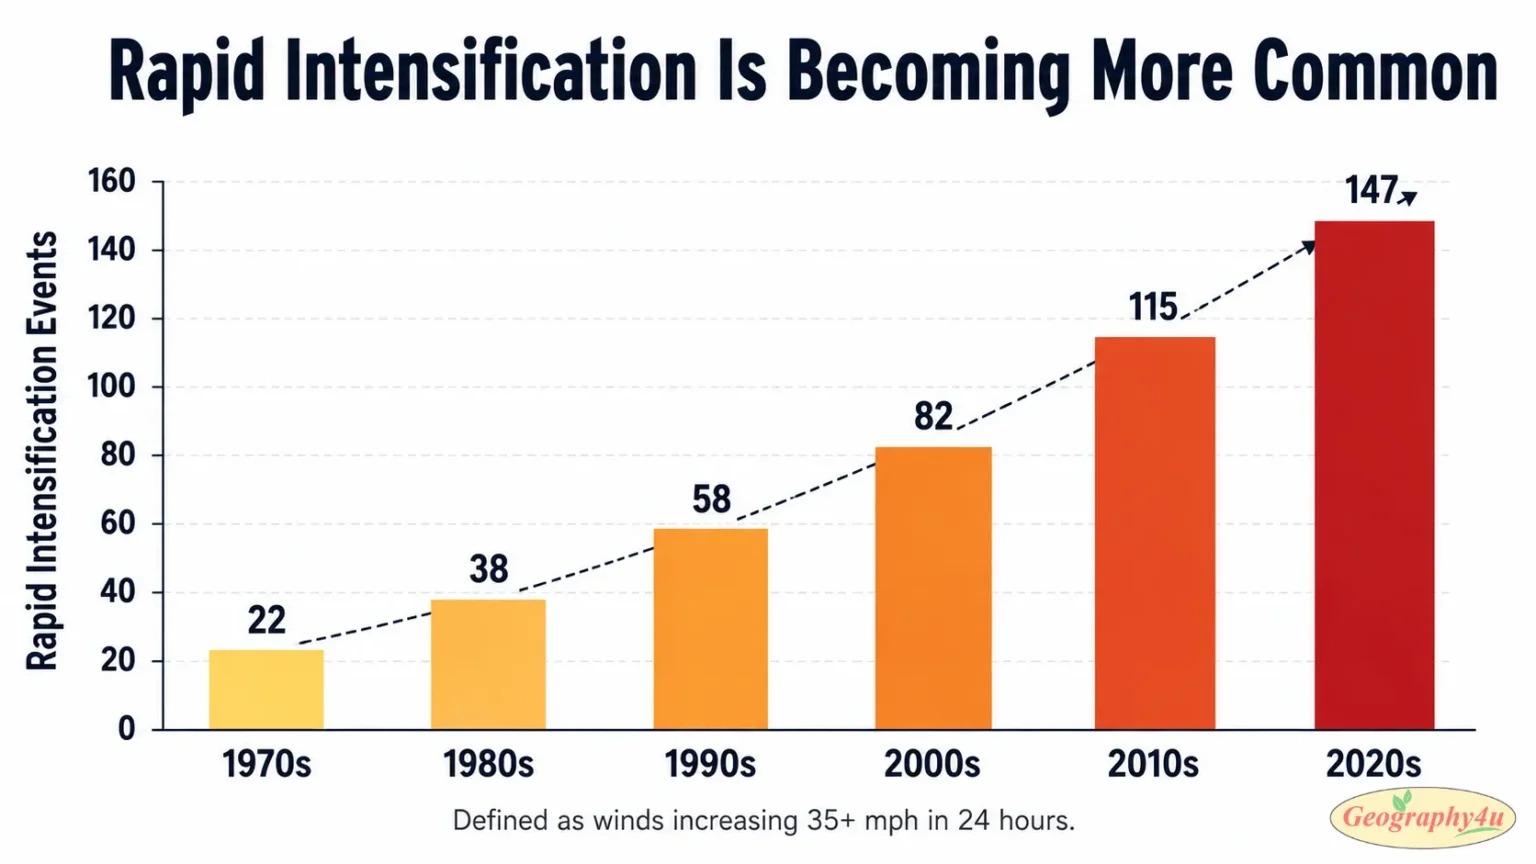
The 2025 Atlantic season showcased this trend dramatically. Three hurricanes reached Category 5 intensity — several of them undergoing rapid intensification over just 24-48 hours. When a storm goes from Category 1 to Category 4 in a single day, evacuation windows shrink from days to hours. For coastal cities, that difference can be measured in lives.
Why is rapid intensification becoming more common? The primary driver is warmer ocean water at depth. As oceans absorb more heat from climate change, the warm water layer extends deeper. When a hurricane’s winds churn up the ocean, they normally bring cooler water to the surface, which cuts off the storm’s fuel. But when the warm water extends deep enough, even churning doesn’t cool the surface — and the storm can continue intensifying without interruption.
NOAA’s deployment of small uncrewed aircraft systems (sUAS) in 2026 represents the first major technological advance in hurricane intensity forecasting in years. Early data suggests the sUAS integration can improve intensity forecast accuracy by 10% — a meaningful improvement that could save lives by better predicting when rapid intensification will occur.
Climate Change and the Future of Cyclones
The relationship between climate change and tropical cyclones is nuanced and often misrepresented. The science does not say “more cyclones.” It says something more concerning: fewer but stronger cyclones, with more rain, higher storm surges, and more rapid intensification.
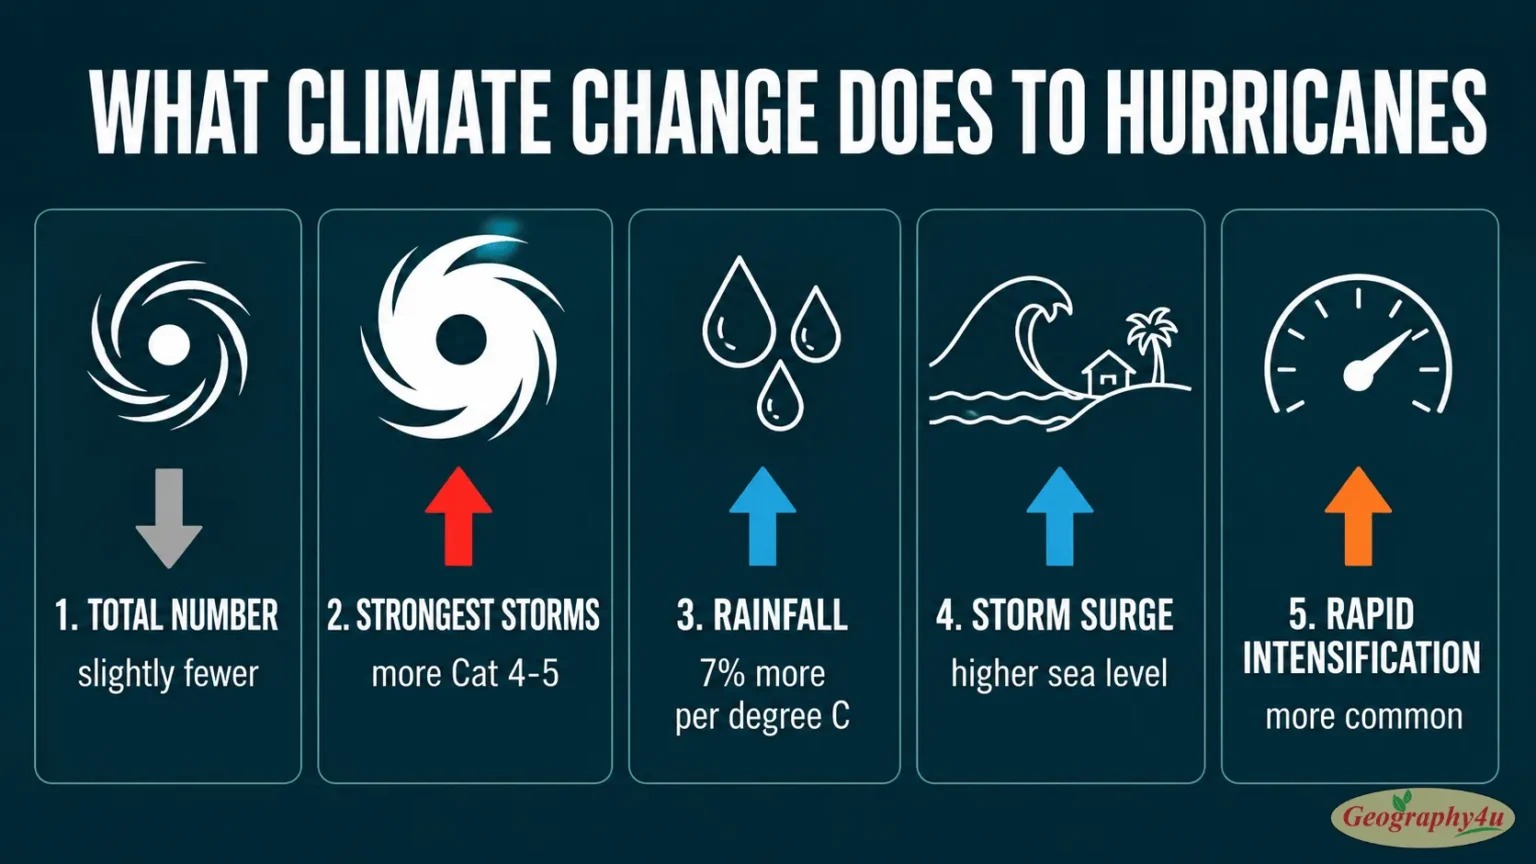
Total number of storms: Climate models generally project a slight decrease in the total number of tropical cyclones globally. Warmer temperatures may increase wind shear and atmospheric stability in some basins, suppressing weaker storms.
Intensity of the strongest storms: The proportion of storms reaching Category 4-5 is projected to increase significantly. The theoretical maximum intensity of tropical cyclones — the “speed limit” set by ocean temperature — rises as oceans warm. We are already seeing this: the 2020s have produced a remarkable concentration of Category 4-5 storms.
Rainfall: Warmer air holds more water vapor (about 7% more per degree Celsius of warming). This means hurricanes in a warmer world dump substantially more rain. Hurricane Harvey (2017) produced over 1.5 meters of rain over Houston — studies suggest climate change made that rainfall 15-38% more intense.
Storm surge: Sea level rise directly increases storm surge heights. Even without any change in storm intensity, a 30 cm rise in sea level means 30 cm higher storm surges everywhere — pushing saltwater further inland across every coastline.
Poleward migration: Some evidence suggests that the latitude at which tropical cyclones reach their maximum intensity is shifting poleward — meaning cities that historically were too far from the tropics to face the strongest storms may find themselves increasingly at risk.
What to Do When a Cyclone Is Coming
Understanding the science is interesting. Knowing what to do when a storm is bearing down on your coastline is essential. The guidance below reflects standard emergency management practice from NOAA, FEMA, and equivalent agencies worldwide.
Before the Season (The Part Everyone Skips)
- Know your evacuation zone. Coastal counties publish evacuation zone maps. Find yours before there is a storm in the forecast — websites crash during emergencies.
- Identify where you would go. Evacuation does not mean driving hundreds of miles. It usually means moving tens of kilometers inland, out of the surge zone. Have a specific destination.
- Assemble supplies early. Water (4 liters per person per day for 7 days), non-perishable food, medications, flashlights, batteries, a battery or hand-crank radio, first aid kit, cash. Stores empty within hours of a warning.
- Document your property. Photograph your home’s interior and exterior. Store insurance documents digitally in cloud storage.
When a Watch Is Issued (48 Hours Out)
A hurricane watch means hurricane conditions are possible within 48 hours. This is when you act — not when the warning comes.
- Fill your vehicle’s fuel tank. Fuel stations lose power and run dry.
- Withdraw cash. ATMs and card readers fail without power.
- Charge every device and power bank.
- Secure or bring inside anything that can become a projectile — patio furniture, garbage bins, garden tools.
- If you are in an evacuation zone, leave. Traffic becomes gridlocked once the warning is issued.
When a Warning Is Issued (36 Hours Out)
A hurricane warning means hurricane conditions are expected within 36 hours. If you have not evacuated and you are in a surge zone, the window is closing.
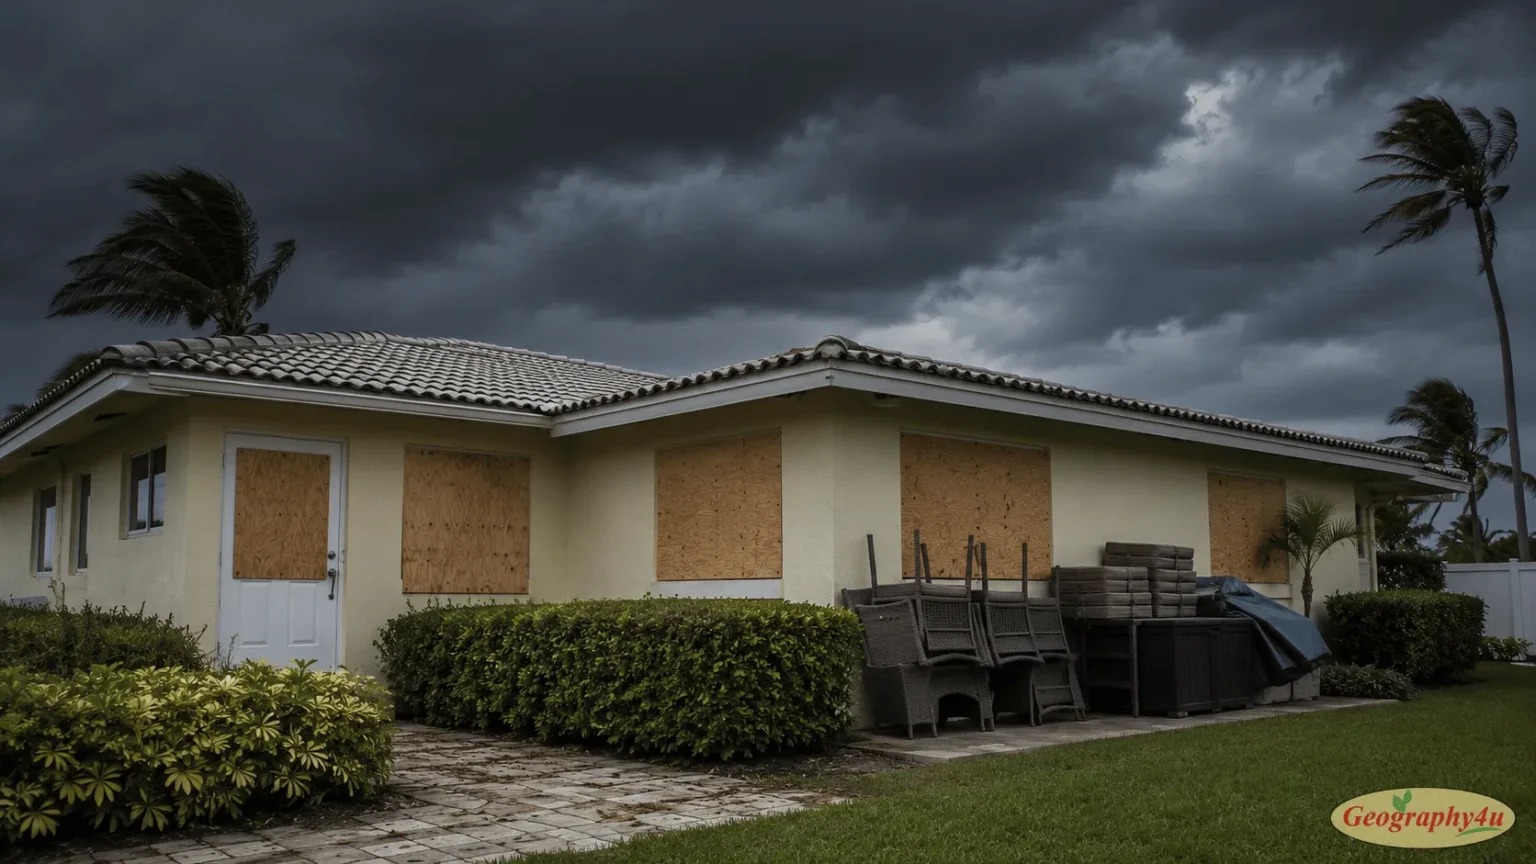
- Board or shutter windows. Tape does nothing — it is a myth.
- Turn refrigerator and freezer to coldest settings; fill empty space with water containers.
- Fill bathtubs with water for sanitation use.
- Move to an interior room on the lowest floor above any flood risk — typically a windowless bathroom or closet.
During the Storm
Stay away from windows, even boarded ones. Do not go outside during the eye — the calm is temporary, and the winds on the far side of the eyewall arrive from the opposite direction with no warning. Keep a radio on for official updates. Do not use candles; use flashlights.
After the Storm
The period after a hurricane causes a substantial share of total fatalities — often from causes that have nothing to do with wind. Carbon monoxide poisoning from generators run indoors or in garages. Electrocution from downed power lines. Injuries from chainsaw use during debris clearing. Floodwater contamination and disease.
- Never run a generator indoors, in a garage, or near windows. Carbon monoxide is odorless and kills quickly.
- Treat every downed power line as live.
- Do not walk or drive through floodwater. Six inches of moving water can sweep a person off their feet; twelve inches can float most vehicles.
- Boil or treat water until authorities confirm the supply is safe.
The single most important rule: Evacuate from water, shelter from wind. If you are in a storm surge zone, leave. If you are inland and away from flooding, sheltering in a well-built structure is usually safer than being on the road. Surge kills; wind mostly destroys property.
Frequently Asked Questions
What is the difference between a hurricane, typhoon, and cyclone?
There is no meteorological difference — they are the same type of storm. The name changes based on location: hurricanes form in the North Atlantic and Northeast Pacific, typhoons form in the Northwest Pacific, and cyclones form in the South Pacific and Indian Ocean. All three are tropical cyclones with sustained winds of 74 mph (119 km/h) or higher, featuring a warm core, an eye, and spiral rain bands.
Why is the 2026 hurricane season below normal?
NOAA predicts a below-normal 2026 Atlantic hurricane season primarily because of a developing El Niño in the Pacific Ocean. El Niño increases vertical wind shear across the Atlantic, which tears apart developing storms before they can organize into hurricanes. NOAA forecasts 8-14 named storms, 3-6 hurricanes, and 1-3 major hurricanes — compared to the 30-year average of 14 named storms and 7 hurricanes.
What is the deadliest cyclone in history?
The 1970 Bhola Cyclone, which struck East Pakistan (now Bangladesh) on November 12, 1970, killing an estimated 300,000 to 500,000 people. A storm surge of up to 35 feet swept over the flat, low-lying Ganges Delta at night. The disaster also triggered political unrest that led to the creation of Bangladesh as an independent nation.
What is rapid intensification?
Rapid intensification is an increase in a tropical cyclone’s maximum sustained winds of at least 35 mph within 24 hours. It is one of the most dangerous aspects of modern hurricanes because it gives coastal communities almost no time to prepare. Climate change is making rapid intensification more common — warmer oceans provide more energy for storms to strengthen quickly.
What is the difference between a tropical cyclone and an extratropical cyclone?
Tropical cyclones are warm-core storms powered by warm ocean water, forming in the tropics with a clear eye and symmetric structure. Extratropical cyclones are cold-core storms that form at mid-latitudes along frontal boundaries where warm and cold air masses collide. Extratropical cyclones are larger but less intense.
How do hurricanes form?
Hurricanes need six conditions: sea surface temperature of at least 26.5°C, sufficient distance from the equator for the Coriolis effect, low vertical wind shear, a pre-existing atmospheric disturbance, high humidity in the mid-troposphere, and atmospheric instability.
Can hurricanes cross the equator?
Essentially no. The Coriolis effect is zero at the equator, so a hurricane would lose the rotational force that sustains it. No hurricane in recorded history has crossed the equator and maintained its structure.
What is a storm surge?
Storm surge is an abnormal rise of seawater driven ashore by a cyclone’s winds. It is the deadliest aspect of any tropical cyclone — responsible for roughly 90% of cyclone fatalities historically. The Bhola Cyclone’s 35-foot surge and Hurricane Katrina’s 28-foot surge are among the most destructive in history.
How are hurricanes named?
The World Meteorological Organization maintains six alphabetical lists of names for the Atlantic basin that rotate on a six-year cycle. Each list has 21 names, alternating male and female, skipping the letters Q, U, X, Y, and Z. A storm receives its name when it reaches tropical storm strength. Names of exceptionally deadly storms — Katrina, Sandy, Maria, Harvey — are permanently retired.
Which ocean basin has the most tropical cyclones?
The Northwest Pacific basin, which affects the Philippines, Japan, Taiwan, China, and Vietnam. It averages about 26 named storms per year — nearly double the Atlantic’s 14. It also produces the strongest storms on Earth, and unlike the Atlantic, it has no official season.
What is the difference between a hurricane watch and a hurricane warning?
A hurricane watch means hurricane conditions are possible within 48 hours — this is when you complete preparations and evacuate if you are in an evacuation zone. A hurricane warning means hurricane conditions are expected within 36 hours — at that point, evacuation routes may already be congested.
Why does the Bay of Bengal have so many deadly cyclones?
The Bay of Bengal produces relatively few cyclones — only 5-6 per year — but seven of the ten deadliest in history occurred there. The Bay’s funnel shape concentrates storm surge, the surrounding land is extremely flat and low-lying, the continental shelf is shallow, and it is one of the most densely populated coastal regions on Earth.
Final Thoughts: Respect the Storm
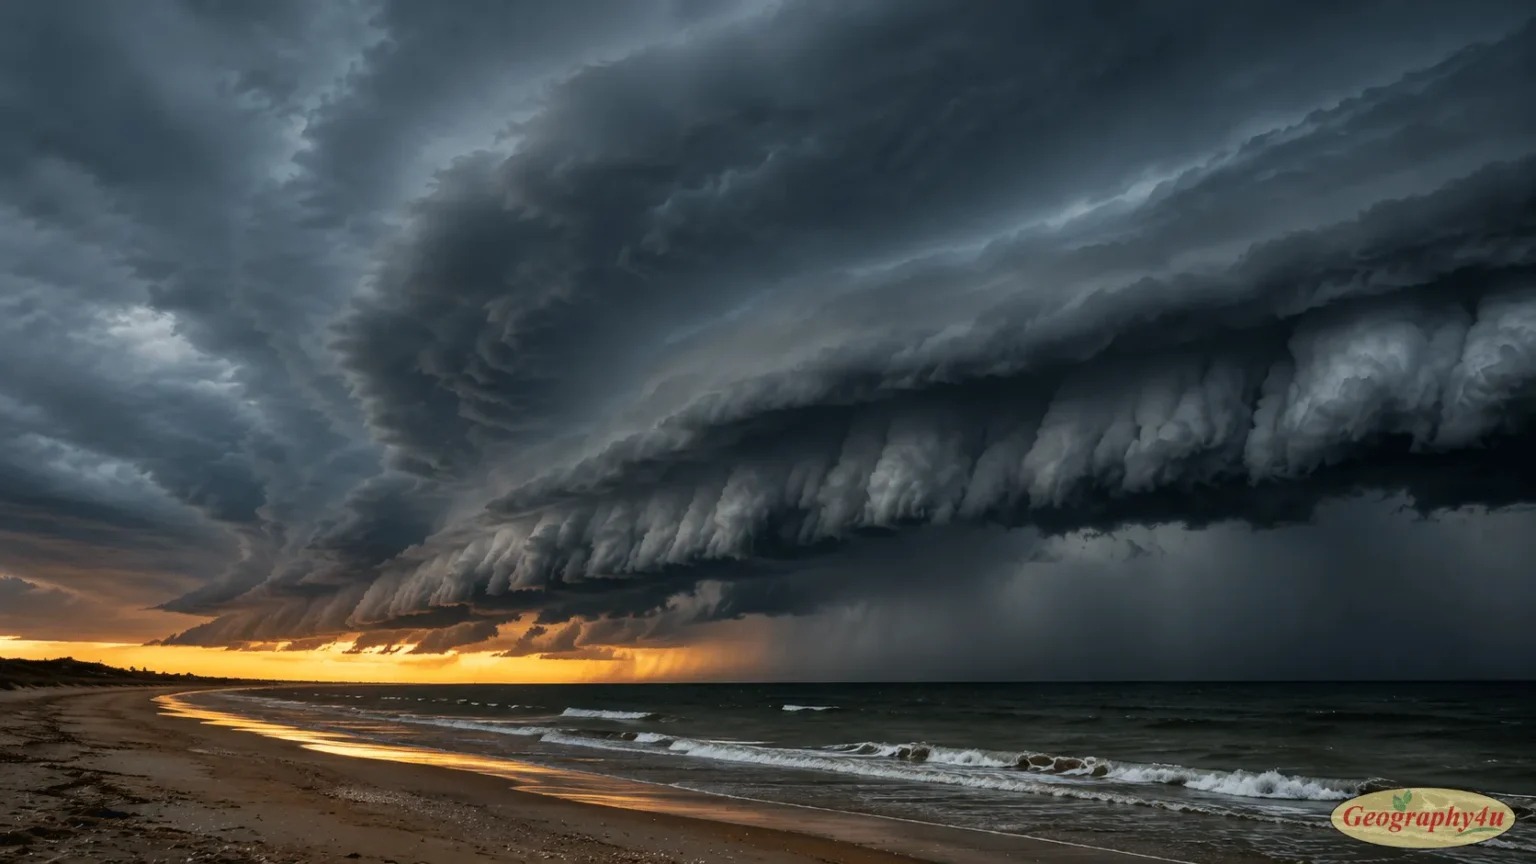
Whether you call it a hurricane, a typhoon, or a cyclone, the physics is the same: warm ocean water, atmospheric instability, and the Coriolis effect combine to create the most powerful weather events on Earth. In a warming world, the strongest of these storms are getting stronger — and the rainfall they produce is getting heavier.
The 2026 Atlantic season is forecast to be quiet, thanks to El Niño. But quiet seasons can produce deadly storms. Hurricane Andrew (1992) occurred in an otherwise below-average season. It takes only one landfalling major hurricane to make a season catastrophic.